

核密度估计(parzen窗密度估计)
matlab中提供了核平滑密度估计函数ksdensity(x):
[f, xi] = ksdensity(x)
返回矢量或两列矩阵x中的样本数据的概率密度估计f。 该估计基于高斯核函数,并且在等间隔的点xi处进行评估,覆盖x中的数据范围。
ksdensity估计单变量数据的100点密度,或双变量数据的900点密度。
ksdensity适用于连续分布的样本。
也可以指定评估点:
[ specifies points (f,xi] = ksdensity(x,pts)pts) to evaluate f. Here, xi and pts contain identical values。
核密度估计方法:

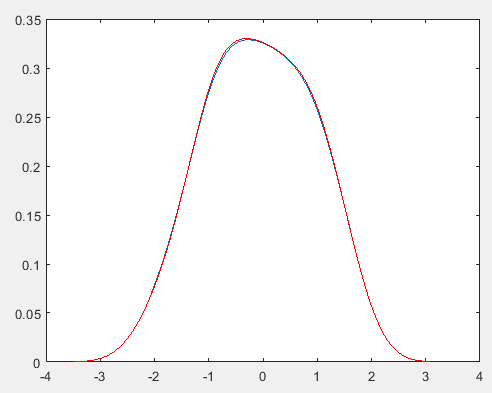
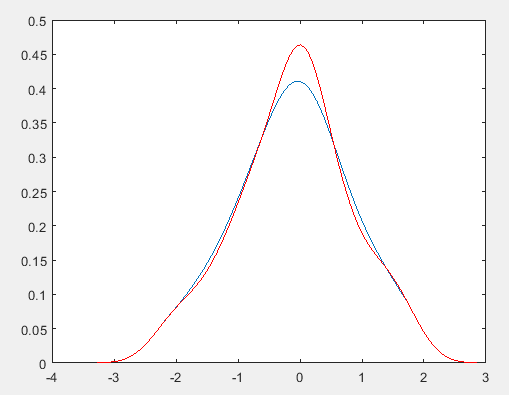
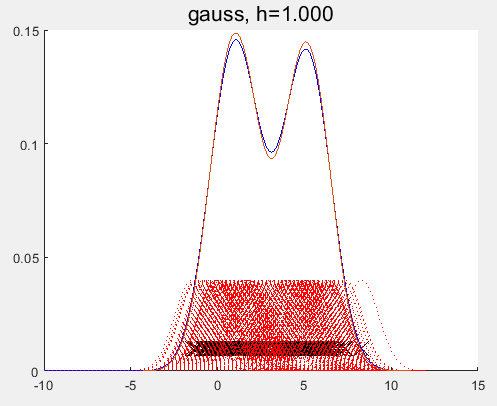
代码实现,对比:
1 2 3 4 5 6 7 8 9 10 11 12 13 14 15 16 17 18 19 20 21 22 23 24 | clear all;clc;n=100;% 生成一些正态分布的随机数x=normrnd(0,1,1,n);minx = min(x);maxx = max(x);dx = (maxx-minx)/n;x1 = minx:dx:maxx-dx;h=0.5;f=zeros(1,n);for j = 1:n for i=1:n f(j)=f(j)+exp(-(x1(j)-x(i))^2/2/h^2)/sqrt(2*pi); end f(j)=f(j)/n/h;endplot(x1,f); %用系统函数计算比较[f2,x2] = ksdensity(x);hold on;plot(x2,f2,'r'); %红色为参考 |
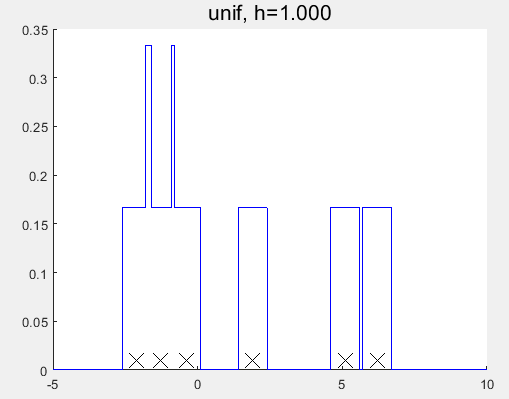
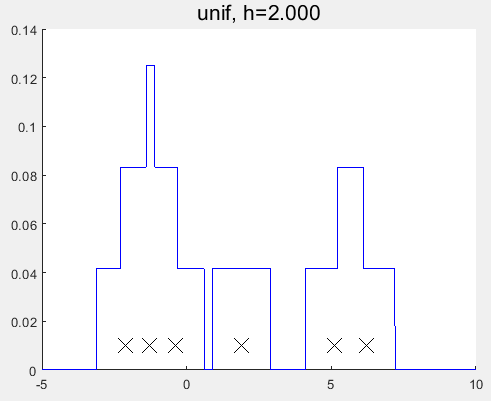
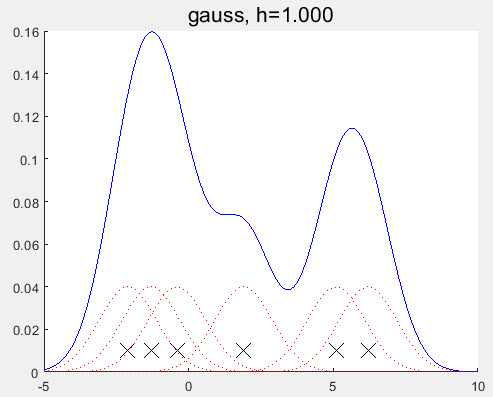
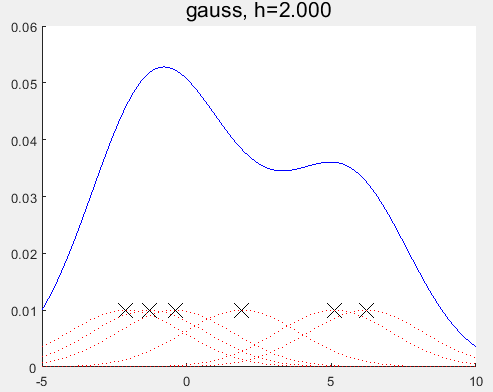
PRML上核密度估计(parzen窗密度估计)的实现:
1 2 3 4 5 6 7 8 9 10 11 12 13 14 15 16 17 18 19 20 21 22 23 24 25 26 27 28 29 30 31 32 33 34 35 36 37 38 39 40 41 42 43 44 45 46 47 48 49 50 51 52 53 54 55 56 57 58 59 60 61 62 63 64 65 66 67 68 69 70 71 72 73 74 75 76 77 78 79 80 81 82 83 84 85 86 87 88 89 90 91 92 93 94 95 96 97 98 99 100 101 102 103 104 105 106 107 108 109 110 111 112 113 114 115 116 117 118 119 120 121 122 123 124 125 126 127 128 129 130 131 132 133 134 135 136 137 138 139 140 141 142 143 144 145 | %% Demonstrate a non-parametric (parzen) density estimator in 1D %% % This file is from pmtk3.googlecode.comfunction parzenWindowDemo2% setSeed(2);%[data, f] = generateData;% http://en.wikipedia.org/wiki/Kernel_density_estimationdata = [-2.1 -1.3 -0.4 1.9 5.1 6.2]';f = @(x) 0;n = numel(data);domain = -5:0.001:10;kernels = {'gauss', 'unif'};for kk=1:2 kernel = kernels{kk}; switch kernel case 'gauss', hvals = [1, 2]; case 'unif', hvals = [1, 2]; end for i=1:numel(hvals) h = hvals(i); figure; hold on handle=plot(data, 0.01*ones(1,n), 'x', 'markersize', 14); set(handle,'markersize',14,'color','k'); g = kernelize(h, kernel, data); plot(domain,g(domain'),'-b'); if strcmp(kernel, 'gauss') for j=1:n k = @(x) (1/h)*gaussProb(x,data(j),h^2); plot(domain, 0.1*k(domain'), ':r'); end end title(sprintf('%s, h=%5.3f', kernel, h), 'fontsize', 16); %printPmtkFigure(sprintf('parzen-%s-%d', kernel, h)); end %placeFigures('nrows',3,'ncols',1,'square',false); endendfunction [data, f] = generateDatamix = [0.35,0.65];sigma = [0.015,0.01];mu = [0.25,0.75];n = 50;%% The true function, we are trying to recoverf = @(x)mix(1)*gaussProb(x, mu(1), sigma(1)) + mix(2)*gaussProb(x, mu(2), sigma(2));%Generate data from a mixture of gaussians.model1 = struct('mu', mu(1), 'Sigma', sigma(1));model2 = struct('mu', mu(2), 'Sigma', sigma(2));pdf1 = @(n)gaussSample(model1, n);pdf2 = @(n)gaussSample(model2, n);data = rand(n,1);nmix1 = data <= mix(1);data(nmix1) = pdf1(sum(nmix1));data(~nmix1) = pdf2(sum(~nmix1));endfunction g = kernelize(h,kernel,data)%Use one gaussian kernel per data point with smoothing parameter h.n = size(data,1);g = @(x)0;%unif = @(x, a, b)exp(uniformLogprob(structure(a, b), x));for i=1:n switch kernel case 'gauss', g = @(x)g(x) + (1/(h*n))*gaussProb(x,data(i),h^2); %case 'unif', g = @(x)g(x) + (1/n)*unif(x,data(i)-h/2, data(i)+h/2); case 'unif', g = @(x)g(x) + (1/(h*n))*unifpdf(x,data(i)-h/2, data(i)+h/2); endendendfunction setupFig(h)figure;hold on;axis([0,1,0,5]);set(gca,'XTick',0:0.5:1,'YTick',[0,5],'box','on','FontSize',16);title(['h = ',num2str(h)]);scrsz = get(0,'ScreenSize');left = 20; right = 20;lower = 50; upper = 125;width = scrsz(3)-left-right;height = (scrsz(4)-lower-upper)/3;set(gcf,'Position',[left,scrsz(4)/2,width, height]);endfunction p = gaussProb(X, mu, Sigma)% Multivariate Gaussian distribution, pdf% X(i,:) is i'th case% *** In the univariate case, Sigma is the variance, not the standard% deviation! ***% This file is from pmtk3.googlecode.comd = size(Sigma, 2);X = reshape(X, [], d); % make sure X is n-by-d and not d-by-nX = bsxfun(@minus, X, rowvec(mu));logp = -0.5*sum((X/(Sigma)).*X, 2); logZ = (d/2)*log(2*pi) + 0.5*logdet(Sigma);logp = logp - logZ;p = exp(logp); endfunction x = rowvec(x)% Reshape a matrix into a row vector% Return x as a row vector. This function is useful when a function returns a% column vector or matrix and you want to immediately reshape it in a functional% way. Suppose f(a,b,c) returns a column vector, matlab will not let you write% f(a,b,c)(:)' - you would have to first store the result. With this function you% can write rowvec(f(a,b,c)) and be assured that the result is a row vector. % This file is from pmtk3.googlecode.com x = x(:)';endfunction y = logdet(A)% Compute log(det(A)) where A is positive-definite% This is faster and more stable than using log(det(A)).%%PMTKauthor Tom Minka% (c) Microsoft Corporation. All rights reserved.% This file is from pmtk3.googlecode.comtry U = chol(A); y = 2*sum(log(diag(U)));catch % #ok y = 0; warning('logdet:posdef', 'Matrix is not positive definite');endend |
对比发现与MATLAB自带的函数的估计结果仍有一定的差异?

参考:
https://ww2.mathworks.cn/help/stats/ksdensity.html
https://zhidao.baidu.com/question/176640010444765324.html
快去成为你想要的样子!


【推荐】国内首个AI IDE,深度理解中文开发场景,立即下载体验Trae
【推荐】编程新体验,更懂你的AI,立即体验豆包MarsCode编程助手
【推荐】抖音旗下AI助手豆包,你的智能百科全书,全免费不限次数
【推荐】轻量又高性能的 SSH 工具 IShell:AI 加持,快人一步
· 10年+ .NET Coder 心语,封装的思维:从隐藏、稳定开始理解其本质意义
· .NET Core 中如何实现缓存的预热?
· 从 HTTP 原因短语缺失研究 HTTP/2 和 HTTP/3 的设计差异
· AI与.NET技术实操系列:向量存储与相似性搜索在 .NET 中的实现
· 基于Microsoft.Extensions.AI核心库实现RAG应用
· 10年+ .NET Coder 心语 ── 封装的思维:从隐藏、稳定开始理解其本质意义
· 地球OL攻略 —— 某应届生求职总结
· 提示词工程——AI应用必不可少的技术
· Open-Sora 2.0 重磅开源!
· 字符编码:从基础到乱码解决