Matlab在极坐标中绘图
在极坐标中绘图
以下示例演示如何在极坐标中创建线图、散点图和直方图。此外,还演示了如何对极坐标图添加注释和更改轴范围。
创建极坐标线图
通过极坐标中的天线以可视方式呈现辐射图。加载文件 antennaData.mat,该文件包含变量 theta 和 rho。变量 rho 用于测量天线对 theta 的每个值的辐射强度。通过使用 polarplot 函数在极坐标中绘制数据图来对该辐射图进行可视化。
load(fullfile(matlabroot,'examples','matlab_featured','antennaData.mat'))

figure
polarplot(theta,rho)

多个极坐标线图
使用 hold on 保留当前极坐标区,然后通过 polarplot 绘制其他数据图。
rng('default')
noisy = rho + rand(size(rho));
hold on
polarplot(theta,noisy)
hold off

为极坐标图添加注释
使用 legend 和 title 之类的注释函数标记与其他可视化类型类似的极坐标图。
legend('Original','With Noise')
title('Antenna Radiation Pattern')

更改极坐标区范围
默认情况下,在极坐标图中,半径的负值将被绘制为正值。使用 rlim 将 r 坐标轴范围调整为包含负值。
rmin = min(rho);
rmax = max(rho);
rlim([rmin rmax])

使用 thetalim 将 theta 坐标轴范围更改为 0 和 180。
thetalim([0 180])

创建极坐标散点图
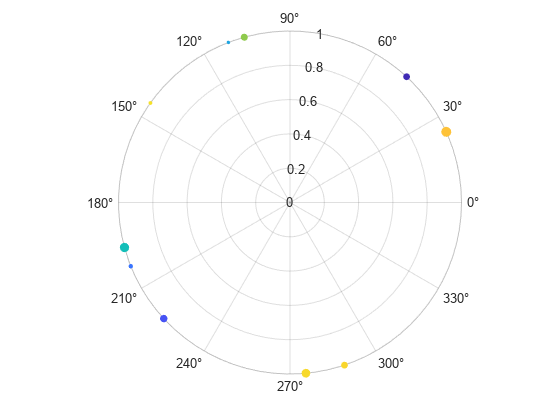
在极坐标中绘制风速数据图。加载文件 windData.dat,该文件包含变量 direction、speed、humidity 和 C。通过使用 polarscatter 函数在极坐标中绘制数据图来以可视方式呈现风速图。
load(fullfile(matlabroot,'examples','matlab_featured','windData.mat'))
polarscatter(direction,speed)

包括第三个数据输入以改变标记大小并表示第三个维度。
polarscatter(direction,speed,humidity)

使用格式化输入调整标记显示属性。
polarscatter(direction,speed,humidity,C,'filled')

创建极坐标直方图
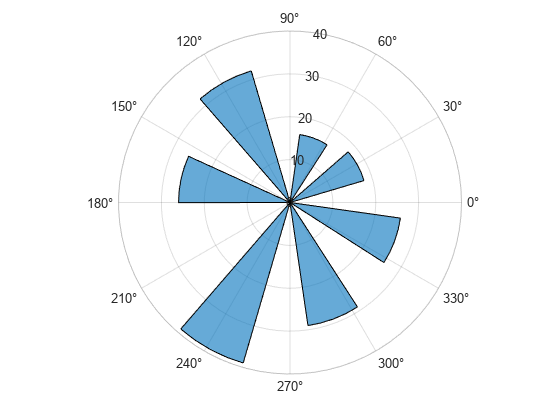
使用 polarhistogram 函数以可视方式呈现数据,这将会生成称为风向图的可视表示形式。
polarhistogram(direction)

指定 bin 确定算法。polarhistogram 函数具有各种确定 bin 数量和 bin 宽度的算法,可从 BinMethod 字段中选择。
polarhistogram(direction,'BinMethod','sqrt')

指定 bin 数量和 bin 宽度。
polarhistogram(direction,24,'BinWidth',.5)

指定归一化方法并调整显示样式以排除任何填充。
polarhistogram(direction,'Normalization','pdf','DisplayStyle','stairs')

posted on 2019-04-04 20:47 那抹阳光1994 阅读(10009) 评论(0) 编辑 收藏 举报


