官网:https://prometheus.io/

下载地址:https://prometheus.io/download/
一、 安装 Prometheus Server
Prometheus 基于 Golang 编写,编译后的软件包,不依赖于任何的第三方依赖。只需要下载对应平台的二进制包,解压并且添加基本的配置即可正常启动 Prometheus Server。
1.下载安装包
[root@ga002 ~]# mkdir -p /data/software && cd /data/software
[root@ga002 /data/software]# wget https://github.com/prometheus/prometheus/releases/download/v2.29.1/prometheus-2.29.1.linux-amd64.tar.gz
2.解压安装包
[root@ga002 /data/software]# mkdir -p /opt/module
[root@ga002 /data/software]# tar -zxvf prometheus-2.29.1.linux-amd64.tar.gz -C /opt/module
3.做软连接
[root@ga002 /data/software]# cd /opt/module
[root@ga002 /opt/module]# ln -s  prometheus-2.29.1.linux-amd64 prometheus
4.修改配置文件
[root@ga002 /opt/module]# cd prometheus

[root@ga002 /opt/module/prometheus]# vim prometheus.yml
# 控制Prometheus 服务器的全局配置
global:
  scrape_interval:     15s # Set the scrape interval to every 15 seconds. Default is every 1 minute.
  evaluation_interval: 15s # Evaluate rules every 15 seconds. The default is every 1 minute.
  # scrape_timeout is set to the global default (10s).

# Alertmanager configuration
alerting:
  alertmanagers:
  - static_configs:
    - targets: ['ga002:9093']
     # - alertmanager: 9093

# 规则配置文件
rule_files:
  - "/opt/module/prometheus/rule.yml"

# 在 scrape_configs 配置项下添加配置:
scrape_configs:
# 添加 Promethus 监控配置
  - job_name: 'prometheus'
    static_configs:
    - targets: ['ga002:9090']

# 添加 PushGateway 监控配置
  - job_name: 'pushgateway'
    static_configs:
    - targets: ['ga002:9091']
      labels:
        instance: pushgateway

# 添加 Node Exporter 监控配置
  - job_name: 'node_exporter'
    metrics_path: /metrics
    static_configs:
      - targets: ['ga002:9100','gd001:9100','ga001:9100','gw001:9100','ga003:9100']

# 添加 Mysql  Exporter 监控配置
  - job_name: 'mysql_exporter'
    metrics_path: /metrics
    static_configs:
      - targets: ['gd001:9104']
        labels:
          instance: gatorade

# 添加 Alertmanger 监控配置
  - job_name: 'alertmanger'
    static_configs:
      - targets: ['ga002:9093']
5.配置文件说明
1、global 配置块:控制Prometheus 服务器的全局配置
scrape_interval:配置拉取数据的时间间隔,默认为 1 分钟。
evaluation_interval:规则验证(生成 alert)的时间间隔,默认为 1 分钟。

2、rule_files 配置块:规则配置文件
3、scrape_configs 配置块:配置采集目标相关, prometheus 监视的目标。Prometheus 自身的运行信息可以通过 HTTP 访问,所以Prometheus 可以监控自己的运行数据。
- job_name:监控作业的名称
- static_configs:表示静态目标配置,就是固定从某个 target 拉取数据
- targets : 指定监控的目标, 其实就是从哪儿拉取数据。 Prometheus 会从 http://ga002:9090/metrics 上拉取数据。
Prometheus 是可以在运行时自动加载配置的。启动时需要添加:--web.enable-lifecycle
二、安装 Pushgateway
Prometheus 在正常情况下是采用拉模式从产生 metric 的作业或者 exporter(比如专门监控主机的Node Exporter)拉取监控数据。但是我们要监控的是 Flink on YARN 作业, 想要让 Prometheus 自动发现作业的提交、结束以及自动拉取数据显然是比较困难的。PushGateway 就是一个中转组件,通过配置Flink on YARN 作业将 metric 推到PushGateway,Prometheus 再从PushGateway 拉取就可以了。
1.下载安装包
[root@ga002 ~]# cd /data/software
[root@ga002 /data/software]# wget https://github.com/prometheus/pushgateway/releases/download/v1.4.2/pushgateway-1.4.2.linux-amd64.tar.gz
2.解压安装包
[root@ga002 /data/software]# mkdir -p /opt/module
[root@ga002 /data/software]# tar -zxvf pushgateway-1.4.2.linux-amd64.tar.gz -C /opt/module
3.做软连接
[root@ga002 /data/software]# cd /opt/module
[root@ga002 /opt/module]# ln -s  pushgateway-1.4.2.linux-amd64 pushgateway
三、安装 Node Exporter
在 Prometheus 的架构设计中,Prometheus Server 主要负责数据的收集,存储并且对外提供数据查询支持,而实际的监控样本数据的收集则是由 Exporter 完成。因此为了能够监控到某些东西,如主机的CPU 使用率,我们需要使用到 Exporter。Prometheus 周期性的从 Exporter 暴露的HTTP 服务地址(通常是/metrics)拉取监控样本数据。

Exporter 可以是一个相对开放的概念,其可以是一个独立运行的程序独立于监控目标以外,也可以是直接内置在监控目标中。只要能够向 Prometheus 提供标准格式的监控样本数据即可。

为了能够采集到主机的运行指标如CPU, 内存,磁盘等信息。我们可以使用Node Exporter。Node Exporter 同样采用 Golang 编写,并且不存在任何的第三方依赖,只需要下载,解压即可运行。可以从 https://prometheus.io/download/ 获取最新的 node exporter 版本的二进制包。
1.下载安装包
#在被管理机ga001,ga002,ga003,gd001,gw001上安装node_exporter组件
[root@ga002 ~]# cd /data/software
[root@ga002 /data/software]# wget https://github.com/prometheus/node_exporter/releases/download/v1.2.2/node_exporter-1.2.2.linux-amd64.tar.gz
2.解压安装包
[root@ga002 /data/software]# mkdir -p /opt/module
[root@ga002 /data/software]# tar -zxvf node_exporter-1.2.2.linux-amd64.tar.gz -C /opt/module
3.做软连接
[root@ga002 /data/software]# cd /opt/module
[root@ga002 /opt/module]# ln -s  node_exporter-1.2.2.linux-amd64 node_exporter
四、安装mysqld_exporter
mysqld_exporter是Prometheus用于监控MySQL指标的一个导出器,支持对MySQL 5.5以上进行监控。使用 mysqld_exporter 来抓取 mysql的一些指标信息。
1.下载安装包
#在被管理机gd001上安装mysqld_exporter组件
[root@gd001 ~]# cd /data/software
[root@gd001 /data/software]# wget https://github.com/prometheus/mysqld_exporter/releases/download/v0.12.1/mysqld_exporter-0.12.1.linux-amd64.tar.gz
2.解压安装包
[root@gd001 /data/software]# mkdir -p /opt/module
[root@gd001 /data/software]# tar -zxvf mysqld_exporter-0.12.1.linux-amd64.tar.gz -C /opt/module
3.做软连接
[root@gd001 /data/software]# cd /opt/module
[root@gd001 /opt/module]# ln -s  mysqld_exporter-0.12.1.linux-amd64  mysqld_exporter
4.数据库授权
[root@gd001 opt]# mysql -u root -p
mysql > GRANT REPLICATION CLIENT, PROCESS ON *.* TO 'mysqlexporter'@'localhost' identified by 'mysqlexporter@dataxgroup';
mysql > GRANT SELECT ON performance_schema.* TO 'mysqlexporter'@'localhost';
mysql > flush privileges;
Query OK, 0 rows affected (0.01 sec)
mysql > quit;
Bye
# (注意:授权ip为localhost,因为不是prometheus服务器来直接找mysql获取数据,而是prometheus服务器找mysql_exporter,mysql_exporter 再找mysql。所以这个localhost是指的mysql_exporter的IP)
5.创建配置文件
# 创建一个mysql配置文件,写上连接的用户名与密码(和上面的授权的用户名 和密码要对应)
[root@gd001 opt]# vim /opt/module/mysqld_exporter/.my.cnf
[client]
user=mysqlexporter
password=mysqlexporter@dataxgroup
五、安装 Alertmanager
Altermanager是Prometheus中的一个独立的告警模块,主要是用针对异常数据进行报警。首先创建一个报警的规则,其次创建路由(给谁发报警信息)。
1.下载安装包
[root@ga002 ~]# cd /data/software
[root@ga002 /data/software]# wget https://github.com/prometheus/alertmanager/releases/download/v0.21.0/alertmanager-0.21.0.linux-amd64.tar.gz
2.解压安装包
[root@ga002 /data/software]# tar -zxvf alertmanager-0.21.0.linux-amd64.tar.gz -C /opt/module
3.做软连接
[root@ga002 /data/software]# cd /opt/module
[root@ga002 /opt/module]# ln -s  alertmanager-0.21.0.linux-amd64 alertmanager
4.建立alertManager报警规则
#1.建立alertManager报警规则
[root@ga002 /opt/module]# cd alertmanager
[root@ga002 /opt/module/alertmanager]# vim alertmanager.yml
global:
  resolve_timeout: 1h	# 警告的间隔时间,默认是:5m

# 邮件告警配置
  smtp_smarthost: 'smtp.mxhichina.com:465'
  smtp_from: 'smtp.mxhichina.com'
  smtp_auth_username: 'mjn.support@DataXgroup.com'
  smtp_auth_password: 'Qdl63aQm'
  smtp_require_tls: true

# 配置报警的模板
templates:
  - '/etc/alertmanager/config/*.tmpl'

# 路由
route:
   # 匹配的标签的ksy
  group_by: ['alertname']
  group_wait: 30s
  group_interval: 5m
  repeat_interval: 4h
  receiver: 'email'
  routes:
    - receiver: 'email'
      match_re:
        # 匹配的是标签的值
        service: '^(warning|critical)$'

# 接收者
receivers:
  - name: 'email'
    email_configs:
      - to: 'li.yang@dataxgroup.com,hui.jin@dataxgroup.com'
        send_resolved: true

#2.检查配置是否生效
[root@ga002 /opt/module/alertmanager]#  ./amtool check-config alertmanager.yml
Checking 'alertmanager.yml'  SUCCESS
Found:
 - global config
 - route
 - 0 inhibit rules
 - 1 receivers
 - 1 templates
  SUCCESS
[root@ga002 /opt/module/alertmanager]# mkdir /etc/alertmanager/config/ -p
5.alertManager报警规则说明
global:
  resolve_timeout: 1h   # 警告的间隔时间,默认是:5m

  # 邮件告警配置
  smtp_smarthost: 'smtp.qq.com:465'
  smtp_from: 'axxxy@qq.com'
  smtp_auth_username: 'axxxy@qq.com'
  smtp_auth_password: 'qxxxxb'
  smtp_require_tls: false

# 配置报警的模板
templates:
  - '/etc/alertmanager/config/*.tmpl'

# 路由
route:
  # 匹配的标签的ksy
  group_by: ['severity']
  group_wait: 30s
  group_interval: 5m
  repeat_interval: 4h
  receiver: 'email'
  routes:
    - receiver: 'email'
      match_re:
      	# 匹配的是标签的值
        service: '^(warning|critical)$'

# 接收者
receivers:
  - name: 'email'
    email_configs:
      - to: '12xxxx30@qq.com'
        send_resolved: true
6.邮件告警模板
[root@ga002 /opt/module/alertmanager]# vim /etc/alertmanager/config/email.tmpl
{{ define "email.to.html" }}
{{ range .Alerts }}
=========start==========<br>
告警程序: prometheus_alert <br>
告警级别: {{ .Labels.severity }} <br>
告警类型: {{ .Labels.alertname }} <br>
故障主机: {{ .Labels.instance }} <br>
告警主题: {{ .Annotations.summary }} <br>
告警详情: {{ .Annotations.description }} <br>
=========end==========<br>
{{ end }}
{{ end }}
六、配置systemctl启动
1.配置Promethus
#1.配置Promethus
[root@ga002 ~]# vim /etc/systemd/system/prometheus.service
[Unit]
Description=Prometheus Server
Documentation=https://prometheus.io/
After=network.target
[Service]
Type=simple
User=root
Restart=on-failure
ExecStart=/opt/module/prometheus/prometheus --config.file=/opt/module/prometheus/prometheus.yml --web.read-timeout=5m  --web.max-connections=10 --storage.tsdb.retention=15d --storage.tsdb.path=/data/prometheus --query.max-concurrency=20 --query.timeout=2m
Restart=on-failure
[Install]
WantedBy=multi-user.target

#2.创建数据目录
[root@ga002 ~]# mkdir /data/prometheus
#3.启动参数解释
–config.file=/etc/prometheus.yml 指定配置文件

–web.read-timeout=5m 请求链接的最大等待时间,防止太多的空闲链接占用资源

–web.max-connections=512 针对prometheus,获取数据源的时候,建立的网络链接数,做一个最大数字的限制,防止链接数过多造成资源过大的消耗

–storage.tsdb.retention=15d 重要参数,prometheus 开始采集监控数据后,会存在内存和硬盘中;对于保存期限的设置。时间过长,硬盘和内存都吃不消;时间太短,要查历史数据就没了。企业15天最为合适。
–storage.tsdb.path="/prometheus/data" 存储数据路径,不要随便定义

–query.max-concurrency=20 用户查询最大并发数

–query.timeout=2m 慢查询强制终止

ps:配置文件不能加双引号,否则启动报错找不到文件或目录,本次启动用户是root生产中最好新建一个用户用于启动,需要设置配置文件及数据文件权限,数据目录在生产中最好单独配置数据硬盘,使用LVM硬盘格式配置。
2.配置Pushgateway
[root@ga002 ~]# vim /etc/systemd/system/pushgateway.service
[Unit]
Description=pushgateway
Documentation=https://prometheus.io/
After=network.target

[Service]
Type=simple
User=prometheus
ExecStart=/opt/module/pushgateway/pushgateway
Restart=on-failure

[Install]
WantedBy=multi-user.target
3.配置Node_exporter
[root@ga001 opt]# vim /etc/systemd/system/node_exporter.service
[Unit]
Description=Node Exporter
Documentation=https://prometheus.io/
Wants=network-online.target
After=network-online.target

[Service]
Type=simple
User=root
ExecStart=/opt/module/node_exporter/node_exporter
Restart=on-failure

[Install]
WantedBy=multi-user.target
4.配置mysqld_exporter
[root@gd001 opt]# vim /etc/systemd/system/mysqld_exporter.service
[Unit]
Description=mysqld_exporter
Documentation=https://prometheus.io/
After=network.target

[Service]
Type=simple
User=mysql
# Environment=DATA_SOURCE_NAME=exporter:exporter123@(localhost:3306)/
ExecStart=/opt/module/mysqld_exporter/mysqld_exporter --web.listen-address=0.0.0.0:9104
  --config.my-cnf /opt/module/mysqld_exporter/.my.cnf \
  --collect.slave_status \
  --collect.slave_hosts \
  --log.level=error \
  --collect.info_schema.processlist \
  --collect.info_schema.innodb_metrics \
  --collect.info_schema.innodb_tablespaces \
  --collect.info_schema.innodb_cmp \
  --collect.info_schema.innodb_cmpmem
Restart=on-failure

[Install]
WantedBy=multi-user.targe
5.配置alertmanager
#1.创建相关数据存放目录
[root@ga002 alertmanager-0.21.0.linux-amd64]# mkdir /data/alertmanager/medate/ -p

#2.配置system启动
[root@ga002 alertmanager-0.21.0.linux-amd64]# vim /etc/systemd/system/alertmanager.service
[Unit]
Description=alertmanager
Documentation=https://prometheus.io/
After=network.target

[Service]
Type=simple
User=root
ExecStart=/opt/module/alertmanager/alertmanager --config.file=/opt/module/alertmanager/alertmanager.yml --storage.path=/data/alertmanager/medate/ --data.retention=120h
Restart=on-failure

[Install]
WantedBy=multi-user.target
七、启动服务
1.重载并启动服务
#1.所有服务器重载服务
[root@ga002 ~]# systemctl daemon-reload

#2.启动node_exporter并设置开机自启
[root@ga002 ~]# systemctl enable --now node_exporter.service

#3.启动mysql_exporter并设置开机自启
[root@gd001 ~]# systemctl enable --now mysqld_exporter.service

#4.启动pushgateway并设置开机自启
[root@ga002 ~]# systemctl enable --now pushgateway.service

#5.启动并设置开机自启
[root@ga002 ~]# systemctl enable --now alertmanager.service

#6.启动promethus并设置开机自启
[root@ga002 ~]# systemctl enable --now promethus.service
八、验证服务
#1.浏览器输入:http://ga002:9090/
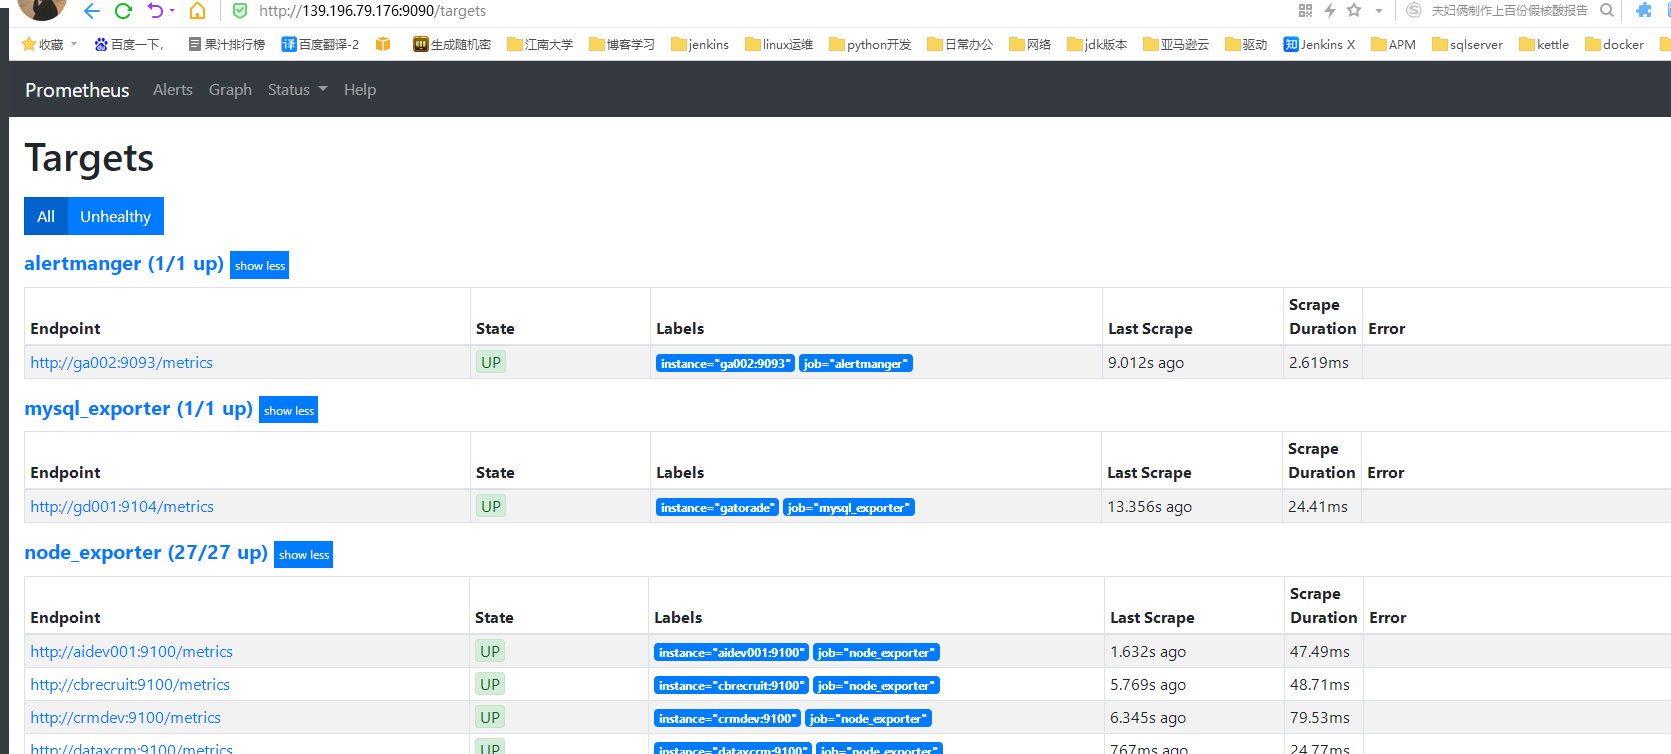
#2.点击 Status,选中 Targets:
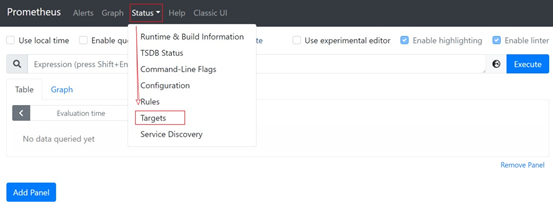
#3.prometheus、pushgateway 和 node exporter、mysqld exporter都是 up 状态,表示安装启动成功:
九、集成Flink
Flink 提供的 Metrics 可以在 Flink 内部收集一些指标,通过这些指标让开发人员更好地理解作业或集群的状态。由于集群运行后很难发现内部的实际状况,跑得慢或快,是否异常等,开发人员无法实时查看所有的 Task 日志。比如作业很大或者有很多作业的情况下,该如何处理?此时 Metrics 可以很好的帮助开发人员了解作业的当前状况。
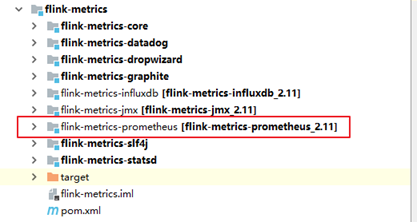
从 Flink 的源码结构我们可以看到,Flink 官方支持 Prometheus,并且提供了对接Prometheus 的jar 包,很方便就可以集成。
1.拷贝jar包
#1.拷贝新的flink 目录,flink-prometheus

#2.将 flink-metrics-prometheus-1.12.0.jar 拷贝到 <flink_home>/lib 目录下
[root@ga002 flink-prometheus]$ cp /opt/module/flink-prometheus/plugins/metrics-prometheus/flink-metrics-prometheus-1.12.0.jar /opt/module/flink-prometheus/lib/

ps:Flink 的 Classpath 位于 lib 目录下,所以插件的jar 包需要放到该目录下
2.修改Flink配置
进入到 Flink 的 conf 目录,修改 flink-conf.yaml
[root@ga002 conf]$ vim flink-conf.yaml

添加如下配置:
##### 与 Prometheus 集 成 配 置 #####
metrics.reporter.promgateway.class:
org.apache.flink.metrics.prometheus.PrometheusPushGatewayReporter

# PushGateway 的主机名与端口号
metrics.reporter.promgateway.host: ga002
metrics.reporter.promgateway.port: 9091

# Flink metric 在前端展示的标签(前缀)与随机后缀
metrics.reporter.promgateway.jobName: flink-metrics-ppg
metrics.reporter.promgateway.randomJobNameSuffix: true
metrics.reporter.promgateway.deleteOnShutdown: false
metrics.reporter.promgateway.interval: 30 SECONDS
3.启动netcat
[root@ga002 sbin]$ nc -lk 9999
4.启动hdfs、yarn,提交 flink 任务到 yarn 上
# 可以通过 8088 跳到flinkUI 的job 页面,查看指标统计
[root@ga002 flink-prometheus]$ bin/flink run -t yarn-per-job -c
com.atguigu.flink.chapter02.Flink03_WordCount_UnboundStream ./flink-base-1.0-SNAPSHOT- jar-with-dependencies.jar
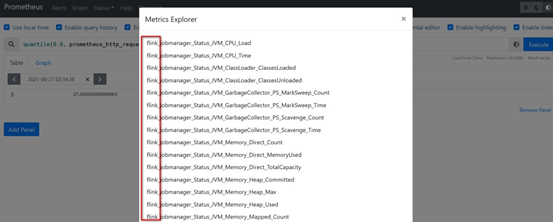
5.刷新 Prometheus 页面,如果有 flink 指标,集成成功

 浙公网安备 33010602011771号