Linux实操篇(进程管理类:常用命令)
接上篇:Linux实操篇(磁盘管理类:常用命令)
ps:查看进程状态
-- 查看进程状态,默认列出当前用户的进程
-- 选项 a:列出带有终端的所有用户进程
-- 选项 x:列出当前用户的所有进程,包括没有终端的进程
-- 选项 u:面向用户友好的显示风格
-- 选项 -e:列出所有进程
-- 选项 -u:列出某个用户关联的所有进程
-- 选项 -f:显示完整格式的进程列表
ps [选项]

-- 常用命令
-- 查看系统中的所有进程
ps aux

-- 查看子父进程之间的关系
ps -ef
直接调用ps命令只会显示当前用户调用的进程
[root@hadoop100 ~]# ps
   PID TTY          TIME CMD
 -- 当前用户调用的终端进程
  4839 pts/0    00:00:00 bash
 -- 当前用户输入ps命令执行调用的进程
  4895 pts/0    00:00:00 ps


-- 显示信息说明
-- USER:该进程是由哪个用户产生的
-- PID:进程的ID号
-- %CPU:当前进程占用CPU的百分占比
-- %MEM:当前进程占用MEMORY(内存空间)的百分占比
-- VSZ:当前进程所占用的虚拟内存
-- RSS:当前进程所占用的实际物理内存,Linux内核会根据算法(LRU)将长时间不使用的内存页面置换到虚拟内存中去,将经常使用的内存页面放在实际物理内存中
-- TTY:当前进程使用的哪个终端进行调用(?:没有终端,是后台服务、tty1:图形化终端、tty2-tty5:本地字符界面终端、pts/0-255:虚拟终端)。
-- STAT:进程状态(R:运行状态、S:睡眠状态、T:暂停状态、Z:僵尸状态(进程已经马上要结束了,但还没有删除干净,因为父进程还需要一些信息,在父进程退出时会删除掉该进程剩余信息,但未删除之前依旧会占用系统资源)、s:包含子进程、l:多线程运行、+:当前进程在前台显示、<:当前进程具有很高的优先级、N:当前进程具有很低的优先级)。
-- START:进程启动的时间
-- TIME:进程占用CPU的运算时间
-- COMMAD:调用进程所执行的命令
[root@hadoop100 ~]# ps aux
USER        PID %CPU %MEM    VSZ   RSS TTY      STAT START   TIME COMMAND
root          1  0.0  0.3 128284  6944 ?        Ss   09:18   0:04 /usr/lib/systemd/systemd --switched-root --system --deroot          2  0.0  0.0      0     0 ?        S    09:18   0:00 [kthreadd]
root          4  0.0  0.0      0     0 ?        S<   09:18   0:00 [kworker/0:0H]
root          6  0.0  0.0      0     0 ?        S    09:18   0:02 [ksoftirqd/0]
root          7  0.0  0.0      0     0 ?        S    09:18   0:00 [migration/0]
root          8  0.0  0.0      0     0 ?        S    09:18   0:00 [rcu_bh]
root          9  0.0  0.0      0     0 ?        S    09:18   0:05 [rcu_sched]
root         10  0.0  0.0      0     0 ?        S<   09:18   0:00 [lru-add-drain]
root         11  0.0  0.0      0     0 ?        S    09:18   0:05 [watchdog/0]
root         12  0.0  0.0      0     0 ?        S    09:18   0:00 [watchdog/1]
root         13  0.0  0.0      0     0 ?        S    09:18   0:00 [migration/1]
root         14  0.0  0.0      0     0 ?        S    09:18   0:00 [ksoftirqd/1]
root         16  0.0  0.0      0     0 ?        S<   09:18   0:00 [kworker/1:0H]
...
...
...
-- 显示信息说明
-- PPID:父进程的ID
-- STIME:进程启动的时间
[root@hadoop100 ~]# ps -ef
UID         PID   PPID  C STIME TTY          TIME CMD
root          1      0  0 09:49 ?        00:00:04 /usr/lib/systemd/systemd --switched-root --system --deserialize 22
root          2      0  0 09:49 ?        00:00:00 [kthreadd]
root          4      2  0 09:49 ?        00:00:00 [kworker/0:0H]
root          6      2  0 09:49 ?        00:00:09 [ksoftirqd/0]
root          7      2  0 09:49 ?        00:00:00 [migration/0]
...
...
...
-- 使用ps -ef命令查看父级子级进程之间的关系,并使用管道符 | 进行筛选,sshd是远程登录进程的守护进程
[root@hadoop100 ~]# ps -ef | grep sshd
-- 当前远程登录的守护进程
root        781      1  0 09:49 ?        00:00:00 /usr/sbin/sshd -D
-- 当前使用终端进行连接登录的进程
root       4831    781  0 14:17 ?        00:00:00 sshd: root@pts/0
-- 输入当前命令所启动的一个相关进程
root       5852   4839  0 15:53 pts/0    00:00:00 grep --color=auto sshd

-- 当前sshd(远程登录守护进程)开机自启动
[root@hadoop100 ~]# systemctl status sshd
● sshd.service - OpenSSH server daemon
   Loaded: loaded (/usr/lib/systemd/system/sshd.service; enabled; vendor preset: enabled)
   Active: active (running) since 一 2022-08-29 09:18:04 CST; 6h ago
     Docs: man:sshd(8)
           man:sshd_config(5)
 Main PID: 781 (sshd)
    Tasks: 1
   CGroup: /system.slice/sshd.service
           └─781 /usr/sbin/sshd -D

8月 29 09:18:03 hadoop100 systemd[1]: Starting OpenSSH server daemon...
8月 29 09:18:04 hadoop100 sshd[781]: Server listening on 0.0.0.0 port 22.
8月 29 09:18:04 hadoop100 sshd[781]: Server listening on :: port 22.
8月 29 09:18:04 hadoop100 systemd[1]: Started OpenSSH server daemon.
8月 29 14:17:27 hadoop100 sshd[4831]: Accepted password for root from 192.168.181.1 port 54256 ssh2
[root@hadoop100 ~]#
kill:终止进程
-- 通过进程ID终止进程
-- 选项 -9:强迫进程立即停止
kill [选项] 进程ID

-- 通过进程名称终止所有相关进程,支持通配符
killall 进程名称
[root@hadoop100 ~]# ps -ef | grep sshd
root       1083      1  0 10:18 ?        00:00:00 /usr/sbin/sshd -D
root       2084   1083  1 10:22 ?        00:00:00 sshd: root@pts/0
root       2133   2092  0 10:23 pts/0    00:00:00 grep --color=auto sshd
-- 终止了自己的进程
[root@hadoop100 ~]# kill 2084
Connection to hadoop100 closed by remote host.
Connection to hadoop100 closed.

C:\Users\shiji>
[root@hadoop100 ~]# kill -l
 1) SIGHUP       2) SIGINT       3) SIGQUIT      4) SIGILL       5) SIGTRAP
 6) SIGABRT      7) SIGBUS       8) SIGFPE       9) SIGKILL     10) SIGUSR1
11) SIGSEGV     12) SIGUSR2     13) SIGPIPE     14) SIGALRM     15) SIGTERM
16) SIGSTKFLT   17) SIGCHLD     18) SIGCONT     19) SIGSTOP     20) SIGTSTP
21) SIGTTIN     22) SIGTTOU     23) SIGURG      24) SIGXCPU     25) SIGXFSZ
26) SIGVTALRM   27) SIGPROF     28) SIGWINCH    29) SIGIO       30) SIGPWR
31) SIGSYS      34) SIGRTMIN    35) SIGRTMIN+1  36) SIGRTMIN+2  37) SIGRTMIN+3
38) SIGRTMIN+4  39) SIGRTMIN+5  40) SIGRTMIN+6  41) SIGRTMIN+7  42) SIGRTMIN+8
43) SIGRTMIN+9  44) SIGRTMIN+10 45) SIGRTMIN+11 46) SIGRTMIN+12 47) SIGRTMIN+13
48) SIGRTMIN+14 49) SIGRTMIN+15 50) SIGRTMAX-14 51) SIGRTMAX-13 52) SIGRTMAX-12
53) SIGRTMAX-11 54) SIGRTMAX-10 55) SIGRTMAX-9  56) SIGRTMAX-8  57) SIGRTMAX-7
58) SIGRTMAX-6  59) SIGRTMAX-5  60) SIGRTMAX-4  61) SIGRTMAX-3  62) SIGRTMAX-2
63) SIGRTMAX-1  64) SIGRTMAX
pstree:查看进程树
-- 查看进程树
-- 选项 -p:显示进程ID
-- 选项 -u:显示进程所属用户
pstree [选项]
-- 若没有该命令,需要使用当前命令安装,当前已经安装了
[root@hadoop100 ~]# yum install pstree
已加载插件:fastestmirror, langpacks
Loading mirror speeds from cached hostfile
 * base: mirrors.ustc.edu.cn
 * extras: mirrors.163.com
 * updates: mirrors.ustc.edu.cn
base                                                                                             | 3.6 kB  00:00:00
extras                                                                                           | 2.9 kB  00:00:00
updates                                                                                          | 2.9 kB  00:00:00
(1/2): updates/7/x86_64/primary_db                                                               |  17 MB  00:00:02
(2/2): extras/7/x86_64/primary_db                                                                | 250 kB  00:00:08
没有可用软件包 pstree。
错误:无须任何处理
top:实时监控当前系统进程状态
-- 实时监控系统进程状态
-- -d 秒数:指定top命令每隔多少秒刷新一次。默认3秒
-- -i:使top不显示任务闲置或者僵死进程
-- -p:通过指定监控进程ID来仅仅监控某个进程状态
top [选项]
netstat:显示网络状态和端口占用信息
-- 查看该进程网络信息
netstat -anp | grep 进程号

-- 查看网络端口号占用情况
netstat -nlp | grep 端口号

-- 选项 -a:显示所有正在监听(listen)和未在监听的套接字(socket)
-- 选项 -n:拒绝显示别名,能显示数字的全部显示数字
-- 选项 -l:仅列出在监听的服务状态
-- 选项 -p:表示显示哪个进程在调用
ipconfig:查看当前所有的网络连接和ip信息
ping:查看网络连接是否通
-- 查看当前是否能访问指定ip地址
ping ip
crontab:系统定时任务
-- 重启crond服务(crontab的守护进程crond)
[root@hadoop100 ~]# systemctl restart crond
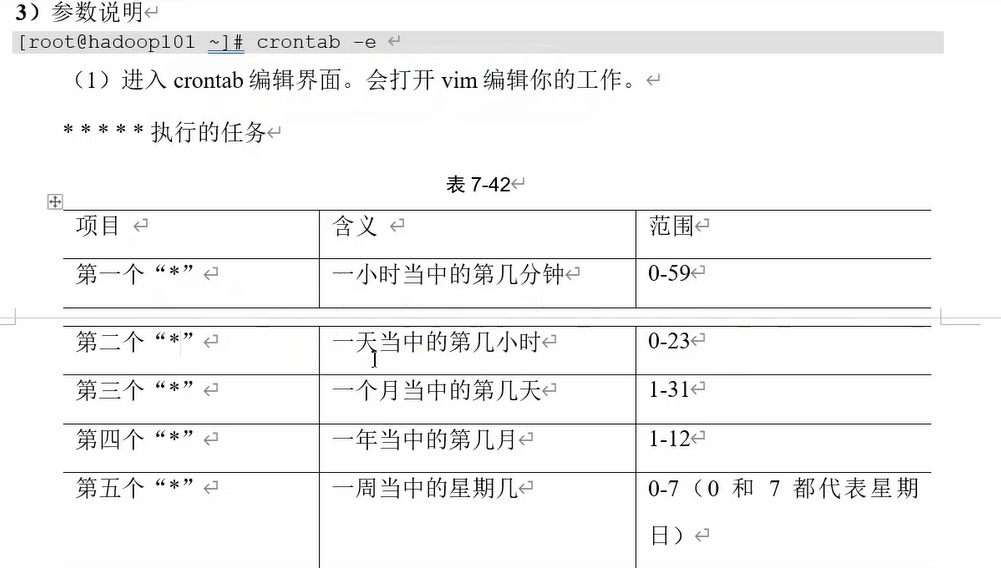
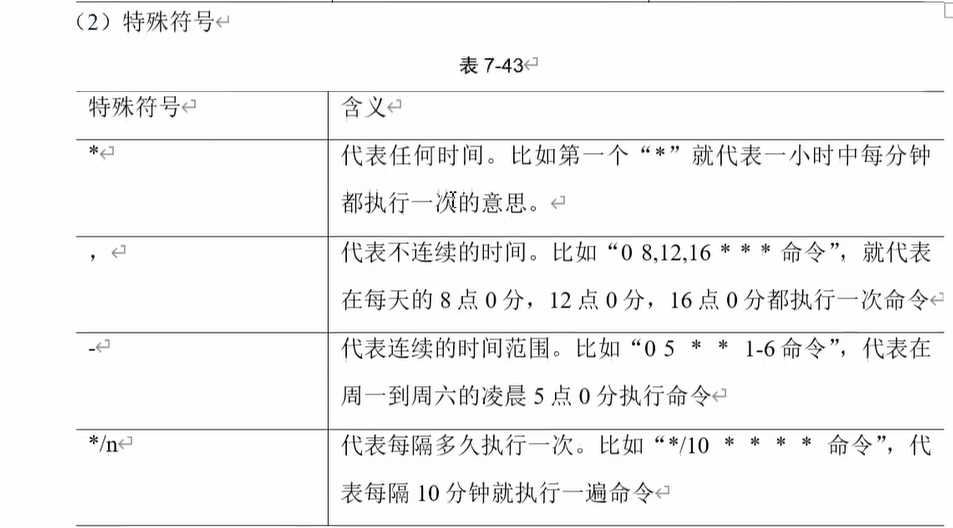
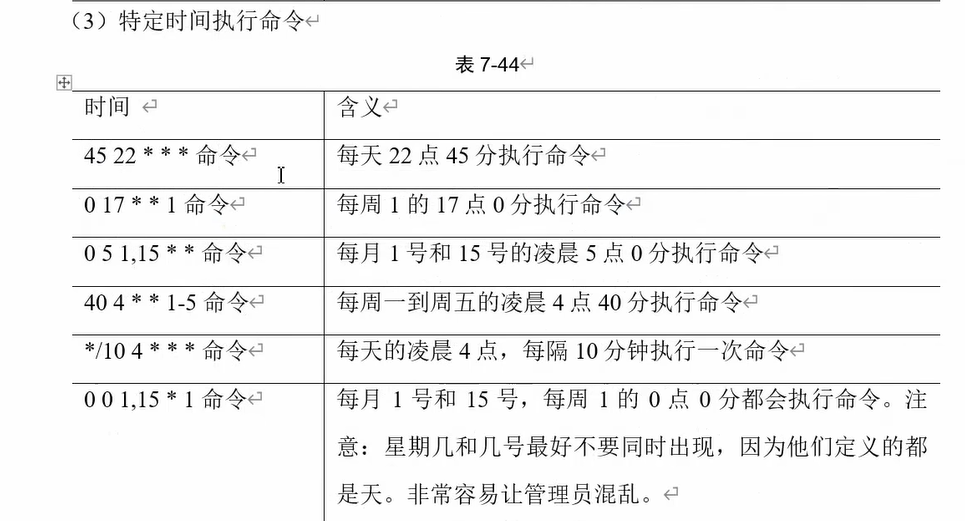
-- 定时任务设置
-- 选项 -e:编辑crontab定时任务
-- 选项 -l:查询crontab任务
-- 选项 -r:删除当前用户所有的crontab任务
crontab [选项]
接下篇:Linux拓展篇(软件包管理)
windows差看当前运行的进程列表:netstat -ano
windows终止进程命令:taskkill -pid 进程号 -f
参考:https://blog.csdn.net/AAA123524457/article/details/125176103

 浙公网安备 33010602011771号