
[matplotlib] 基础知识
基本架构
-
脚本层(scripting)
脚本层是 Matplotlib 结构中的最顶层。我们编写的绘图代码大部分代码都在该层运行,它的主要工作是负责生成图形与坐标系。 -
美工层(artist)
美工层是结构中的第二层,它提供了绘制图形的元素时的给各种功能,例如,绘制标题、轴标签、坐标刻度等。 -
后端层(backend)
后端层是 Matplotlib 最底层,它定义了三个基本类,首先是 FigureCanvas(图层画布类),它提供了绘图所需的画布,其次是 Renderer(绘图操作类),它提供了在画布上进行绘图的各种方法,最后是 Event(事件处理类),它提供了用来处理鼠标和键盘事件的方法。
图形组成
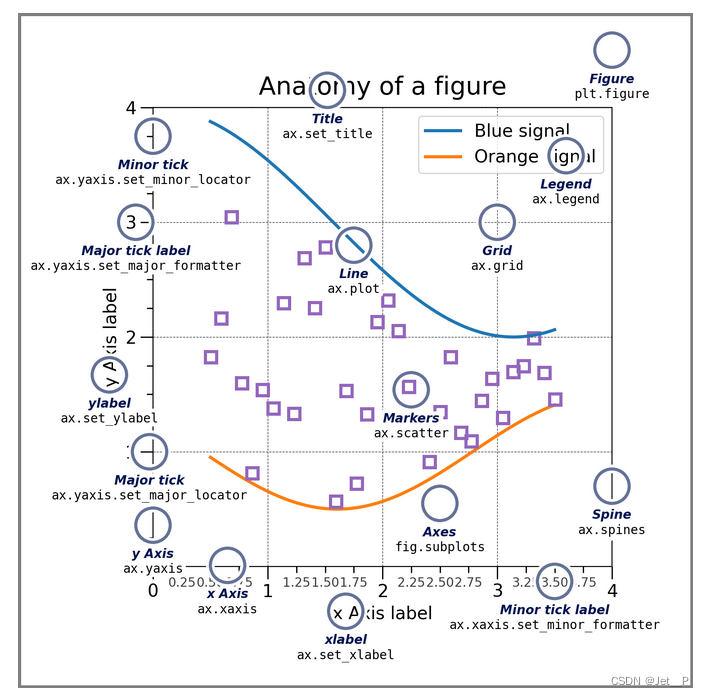
- Figure
指整个图形,您可以把它理解成一张画布,Axes都在Figure上;
创建FIgure的方式
import matplotlib as mpl
import matplotlib.pyplot as plt

# 第一种方法 直接创建单个figure对象
fig = plt.figure()
#第二种方法  通过subplots等相关函数创建figure同时创建axes
fig, ax = plt.subplots()
-
Axes
绘制 图像的实际区域,也称为轴域区,或者绘图区; -
Artist
您在画布上看到的所有元素都属于 Artist 对象,包括figure和axes,如文本对象(title、xlabel、ylabel)、Line2D 对象(用于绘制2D图像)等; -
Axis
指坐标系中的垂直轴与水平轴,包含轴的长度大小、轴标签和刻度标签。
编程方式
- OO方式
fig, ax = plt.subplots(figsize=(5, 2.7), layout='constrained')
ax.plot(x, x, label='linear')  # Plot some data on the axes.
ax.plot(x, x**2, label='quadratic')  # Plot more data on the axes...
ax.plot(x, x**3, label='cubic')  # ... and some more.
ax.set_xlabel('x label')  # Add an x-label to the axes.
ax.set_ylabel('y label')  # Add a y-label to the axes.
ax.set_title("Simple Plot")  # Add a title to the axes.
ax.legend()  # Add a legend.
- pyplot 方式
plt.figure(figsize=(5, 2.7), layout='constrained')
plt.plot(x, x, label='linear')  # Plot some data on the (implicit) axes.
plt.plot(x, x**2, label='quadratic')  # etc.
plt.plot(x, x**3, label='cubic')
plt.xlabel('x label')
plt.ylabel('y label')
plt.title("Simple Plot")
plt.legend()

 浙公网安备 33010602011771号