
php--xdebug调试
1.wamp环境idea 添加xdebug 调试php
修改
phpForApache.ini
[xdebug]
zend_extension ="D:/soft/php/wamp64/bin/php/php5.6.25/zend_ext/php_xdebug-2.4.1-5.6-vc11-x86_64.dll"
;xdebug.remote_enable = off
;xdebug.profiler_enable = off
;xdebug.profiler_enable_trigger = off
;xdebug.profiler_output_name = cachegrind.out.%t.%p
;xdebug.profiler_output_dir ="D:/soft/php/wamp64/tmp"
;xdebug.show_local_vars=0


xdebug.profiler_enable = 0

xdebug.profiler_enable_trigger = 0

xdebug.profiler_output_name = cachegrind.out.%t.%p

xdebug.profiler_output_dir ="D:/soft/php/wamp64/tmp"

xdebug.auto_trace = 0

xdebug.show_local_vars=0

xdebug.var_display_max_children=128

xdebug.var_display_max_data=512

xdebug.var_display_max_depth=5

xdebug.idekey=netbeans-xdebug

xdebug.remote_enable = On

;IDE所在机器IP

xdebug.remote_host=127.0.0.1

;IDE监听的端口号,用来和服务端的XDEBUG通信用

xdebug.remote_port=9000

xdebug.remote_handler=dbgp

; //这个要加上,否则无法调试,这个配置的作用是当配置的远程IDE的host和端口号有问题时,会通过请求头读取IDE的IP从而完成通信

xdebug.remote_connect_back=1

xdebug.remote_autostart=0
2.重启wamp
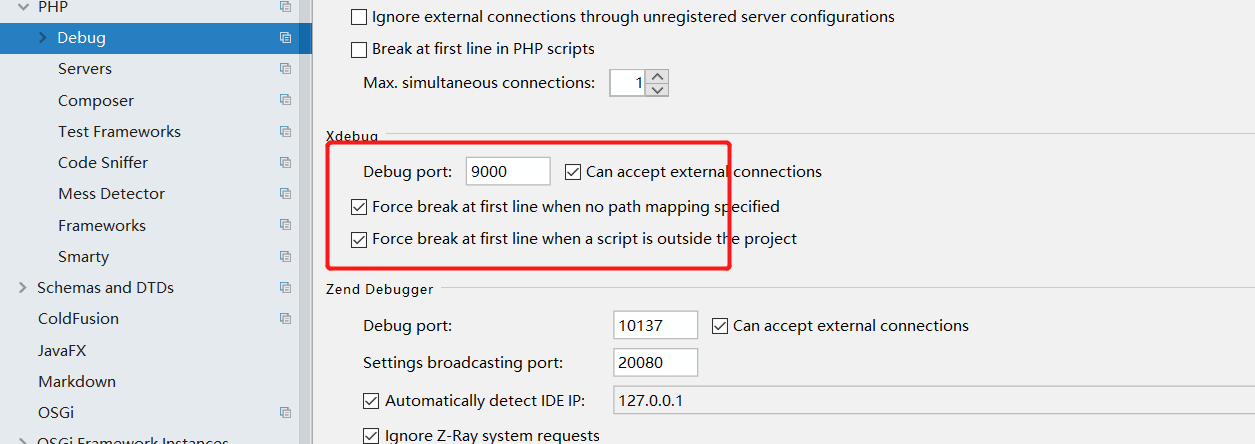
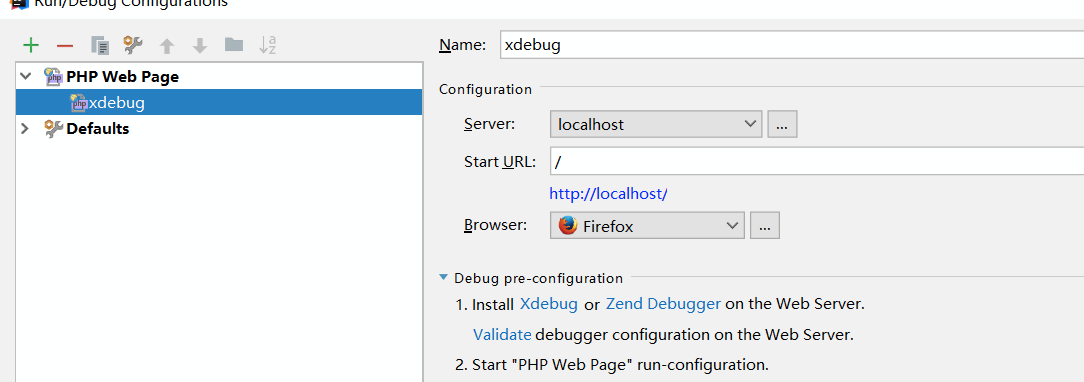
3.idea设置
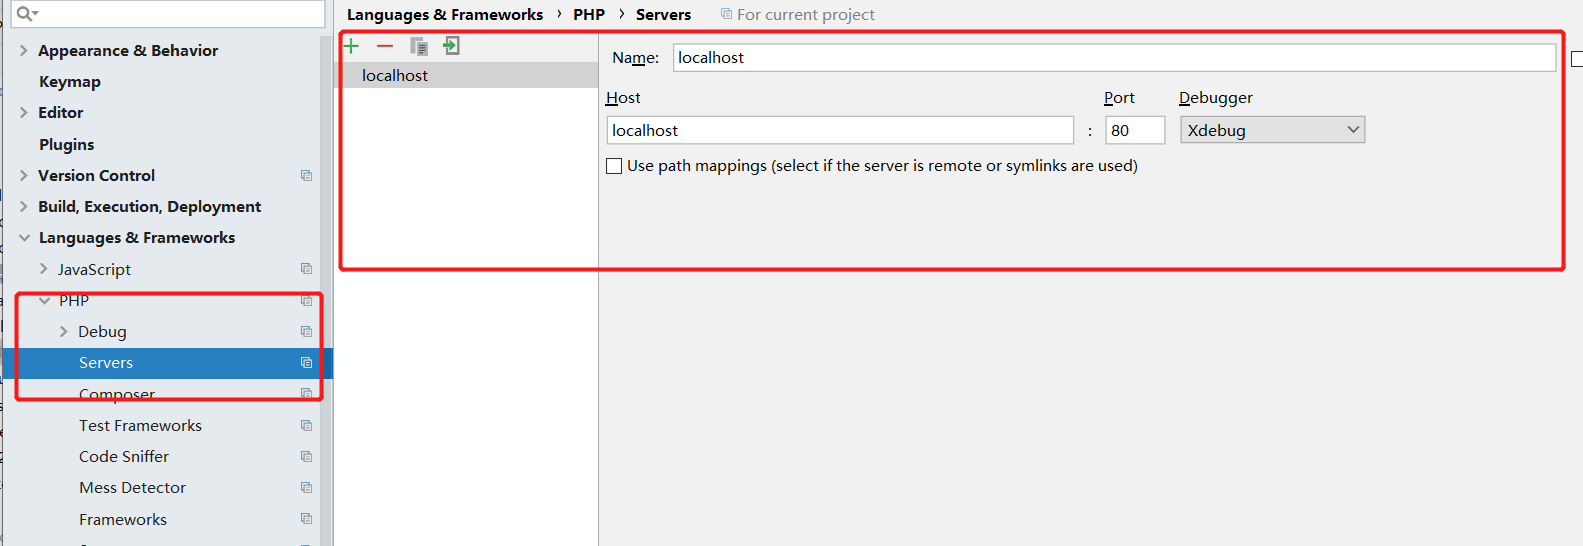
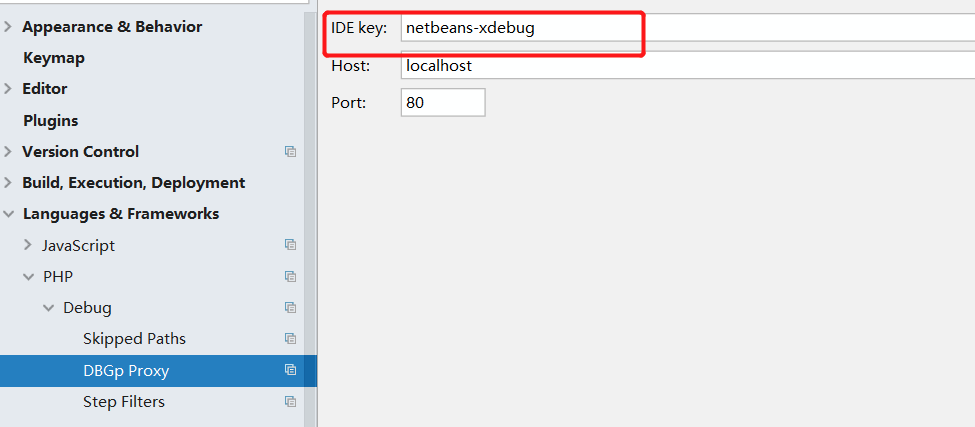
key和phpForApache.ini中xdebug.idekey=netbeans-xdebug对应
端口和phpForApache.ini中xdebug.remote_port=9000对应

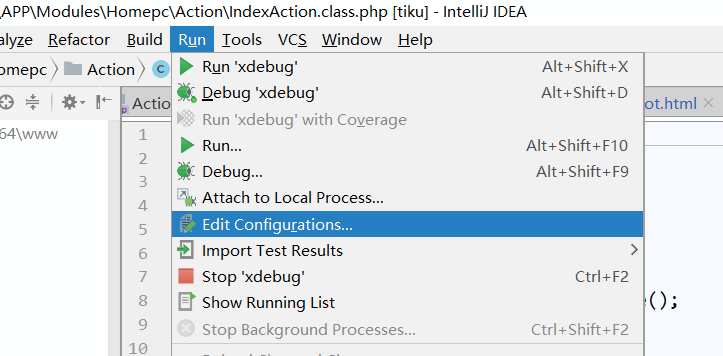
启动监听
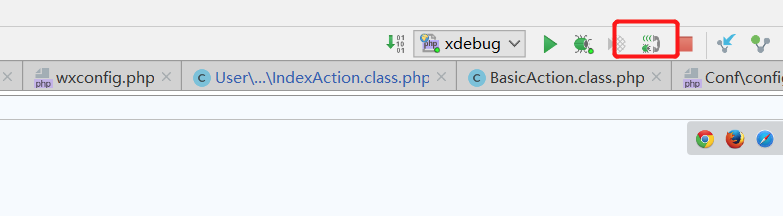
在代码中添加断点进行调试


 浙公网安备 33010602011771号