北京市信件内容爬虫实例——首都之窗
网址:http://www.beijing.gov.cn/hudong/hdjl/com.web.search.mailList.flow
Python爬虫代码:
import requests
import re
import xlwt
# #https://flightaware.com/live/flight/CCA101/history/80
url = 'http://www.beijing.gov.cn/hudong/hdjl/com.web.consult.consultDetail.flow?originalId=AH20021300174'
headers = {
    "user-agent": "Mozilla/5.0 (Windows NT 10.0; WOW64) AppleWebKit/537.36 (KHTML, like Gecko) Chrome/77.0.3865.90 Safari/537.36"
}
def get_page(url):
    try:
        response = requests.get(url, headers=headers)
        if response.status_code == 200:
            print('获取网页成功')
            return response.text
        else:
            print('获取网页失败')
    except Exception as e:
        print(e)
f = xlwt.Workbook(encoding='utf-8')
sheet01 = f.add_sheet(u'sheet1', cell_overwrite_ok=True)
sheet01.write(0, 0, '序号')  # 第一行第一列
sheet01.write(0, 1, '问')  # 第一行第二列
sheet01.write(0, 2, '来信人')  # 第一行第三列
sheet01.write(0, 3, '时间')  # 第一行第四列
sheet01.write(0, 4, '网友同问')  # 第一行第五列
sheet01.write(0, 5, '问题内容')  # 第一行第六列
sheet01.write(0, 6, '答')  # 第一行第七列
sheet01.write(0, 7, '答复时间')  # 第一行第八列
sheet01.write(0, 8, '答复内容')  # 第一行第九列
fopen = open('C:\\Users\\hp\\Desktop\\list.txt', 'r')
lines = fopen.readlines()
temp=0
temp1=0
urls = ['http://www.beijing.gov.cn/hudong/hdjl/com.web.consult.consultDetail.flow?originalId={}'.format(line) for line in lines]
for url in urls:
     print(url.replace("\n", ""))
     page = get_page(url.replace("\n", ""))
     items = re.findall('<div class="col-xs-10 col-sm-10 col-md-10 o-font4 my-2"><strong>(.*?)</strong></div>.*?<div class="col-xs-10 col-lg-3 col-sm-3 col-md-4 text-muted ">(.*?)</div>.*?<div class="col-xs-5 col-lg-3 col-sm-3 col-md-3 text-muted ">(.*?)</div>.*?<div class="col-xs-4 col-lg-3 col-sm-3 col-md-3 text-muted ">(.*?)<label.*?">(.*?)</label>.*? <div class="col-xs-12 col-md-12 column p-2 text-muted mx-2">(.*?)</div>.*?<div class="col-xs-9 col-sm-7 col-md-5 o-font4 my-2">.*?<strong>(.*?)</div>.*?<div class="col-xs-12 col-sm-3 col-md-3 my-2 ">(.*?)</div>.*?<div class="col-xs-12 col-md-12 column p-4 text-muted my-3">(.*?)</div>',page,re.S)
     print(items)
     print(len(items))
     for i in range(len(items)):
        sheet01.write(temp + i + 1, 0,temp+1)
        sheet01.write(temp + i + 1, 1,items[i][0].replace( ' ','').replace(' ',''))
        sheet01.write(temp + i + 1, 2, items[i][1].replace('来信人:\r\n\t      \t\r\n        \t\r\n\t        \t','').replace( '\r\n        \t\r\n          ',''))
        sheet01.write(temp + i + 1, 3, items[i][2].replace('时间:',''))
        sheet01.write(temp + i + 1, 4, items[i][4].replace('\r\n\t\t        \t\r\n\t                \t','').replace('\r\n\t                \r\n\t                \r\n                ',''))
        sheet01.write(temp + i + 1, 5,items[i][5].replace('\r\n\t    \t', '').replace('\r\n\t    ', '').replace('<p>','').replace('   ','').replace(' ','').replace('  ','').replace('    ',''))
        sheet01.write(temp + i + 1, 6,items[i][6].replace('</strong>', ''))
        sheet01.write(temp + i + 1, 7,items[i][7])
        sheet01.write(temp + i + 1, 8, items[i][8].replace('\r\n\t\t\t\t\t\t\t\t','').replace('    ','').replace('\r\n\t\t\t\t\t\t\t','').replace('<p>','').replace('   ','').replace(' ','').replace('  ',''))
     temp+=len(items)
     temp1+=1
     print("总爬取完毕数量:"+str(temp1))
     print("打印完!!!")
     f.save('letter.xls')
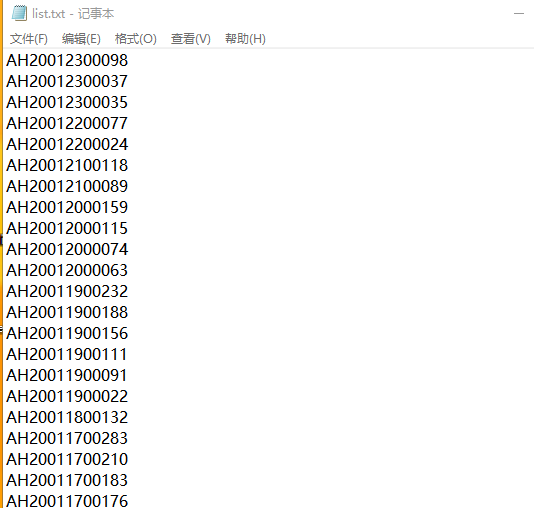
C:\\Users\\hp\\Desktop\\list.txt':这个文件是所有信件内容网址的后缀:
如果需要请加Q:893225523
将爬虫结果主要分为:序号、问、时间、网友同问、问题内容、答、答复时间、答复内容
存储到Execl:
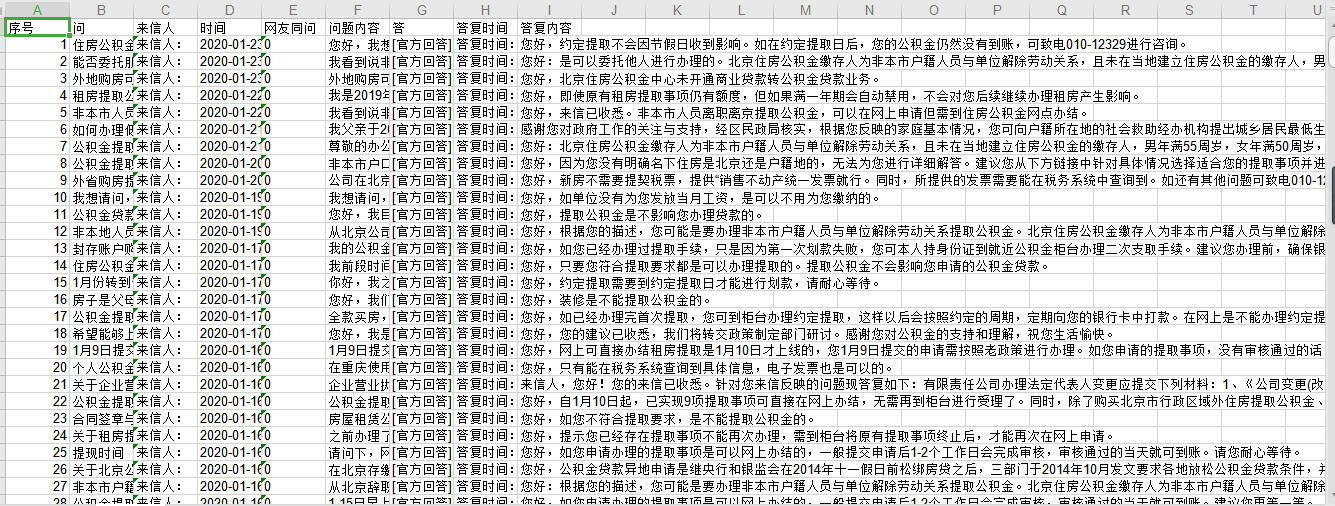
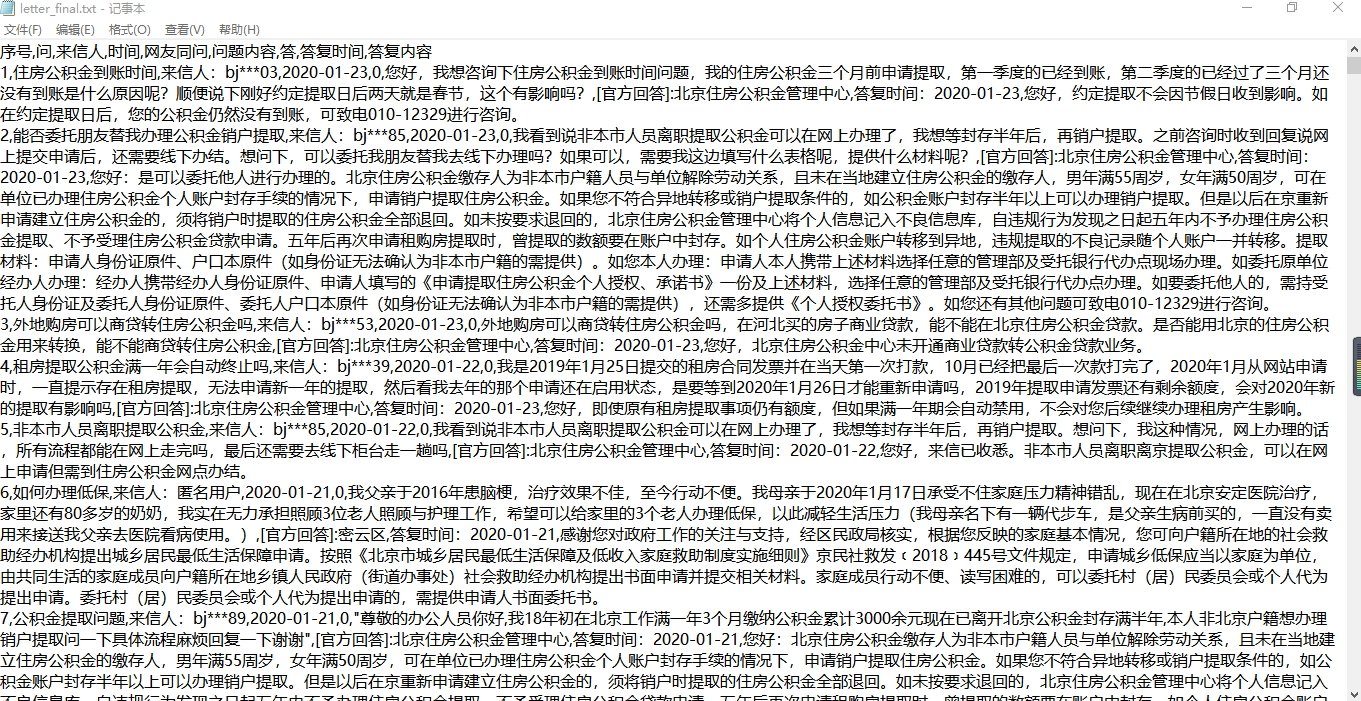
然后为了方便清洗数据,首先让execl表格转换为csv(自动以逗号间隔),然后用记事本打开,复制粘贴到txt文件中,通过FileZilla上传到虚拟机里。
特别注意,一定要在execl表里面选中所有单元格,将所有内容的英文字段改为中文字段,以防止阻碍数据清洗。

这是最终的txt文件:
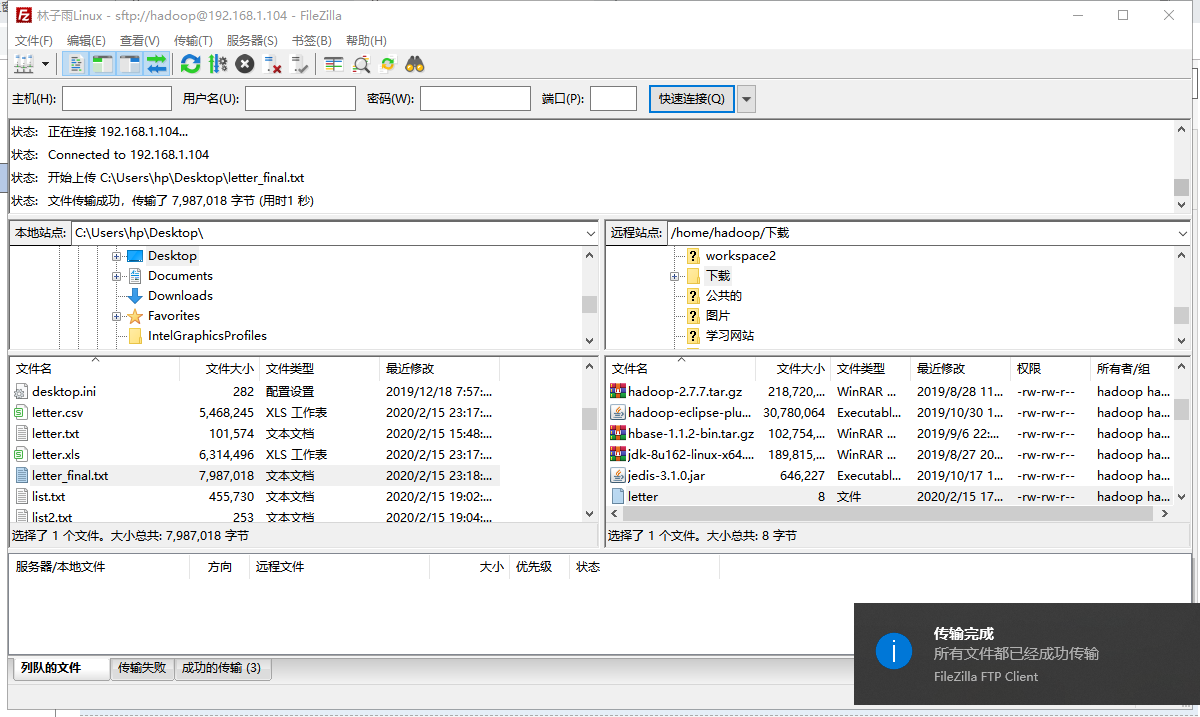
打开虚拟机:将文件上传到mapreduce,开始进行数据清洗。

package letter_count;

import java.io.IOException;

import org.apache.hadoop.fs.Path;
import org.apache.hadoop.io.IntWritable;
import org.apache.hadoop.io.Text;
import org.apache.hadoop.mapreduce.Job;
import org.apache.hadoop.mapreduce.Mapper;
import org.apache.hadoop.mapreduce.Reducer;
import org.apache.hadoop.mapreduce.Mapper.Context;
import org.apache.hadoop.mapreduce.lib.input.FileInputFormat;
import org.apache.hadoop.mapreduce.lib.output.FileOutputFormat;

import test4.quchong;
import test4.quchong.doMapper;
import test4.quchong.doReducer;

public class letter {
	public static class doMapper extends Mapper<Object,Text,Text,IntWritable>{
		public static final IntWritable one = new IntWritable(1);
		public static Text word = new Text();
		@Override
		protected void map(Object key, Text value, Context context)
		throws IOException,InterruptedException {
		//StringTokenizer tokenizer = new StringTokenizer(value.toString(),"  ");
			   String[] strNlist = value.toString().split(",");
			  // String str=strNlist[3].trim();
			   String str2=strNlist[3].substring(0,4);
			   System.out.println(str2);
			// Integer temp= Integer.valueOf(str);
		word.set(str2);
		//IntWritable abc = new IntWritable(temp);
		context.write(word,one);
		}
		}
		public static class doReducer extends Reducer<Text,IntWritable,Text,IntWritable>{
			private IntWritable result = new IntWritable();
			@Override
			protected void reduce(Text key,Iterable<IntWritable> values,Context context)
			throws IOException,InterruptedException{
			int sum = 0;
			for (IntWritable value : values){
			sum += value.get();
			}
			result.set(sum);
			context.write(key,result);
			}
			}
		public static void main(String[] args) throws IOException,ClassNotFoundException,InterruptedException {
			Job job = Job.getInstance();
			job.setJobName("letter");
			job.setJarByClass(quchong.class);
			job.setMapperClass(doMapper.class);
			job.setReducerClass(doReducer.class);
			job.setOutputKeyClass(Text.class);
			job.setOutputValueClass(IntWritable.class);
			Path in = new
                        Path("hdfs://localhost:9000/JCC/letter_final.txt");
			Path out = new Path("hdfs://localhost:9000/JCC/out1");
			FileInputFormat.addInputPath(job,in);
			FileOutputFormat.setOutputPath(job,out);
			System.exit(job.waitForCompletion(true) ? 0 : 1);
		}
}
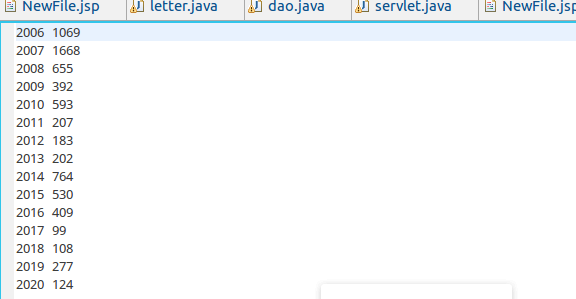
清洗完的数据:
然后打开虚拟机数据库:

输入建表语句:
create table letter
    -> (
    -> year varchar(255),
    -> num int(11));
txt 导入mysql,首先将准备导入的文件放到mysql_files目录下,(/var/lib/mysql-files)然后确保自己的local_infile是“ON”状态。
SHOW VARIABLES LIKE '%local%';(set global local_infile='ON';)可以开启。最后导入LOAD DATA INFILE '/var/lib/mysql-files/part-r-00000' INTO TABLE stage1 fields terminated by ',';
(show variables like '%secure%';)来查看自己mysql-files的路径。
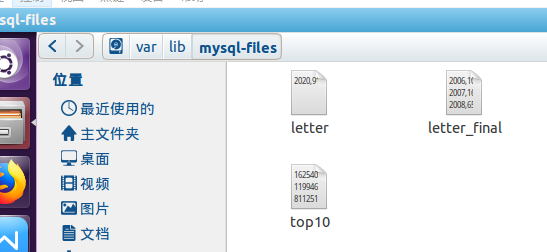
将letter_final文件复制到/var/lib/mysql-files目录下:
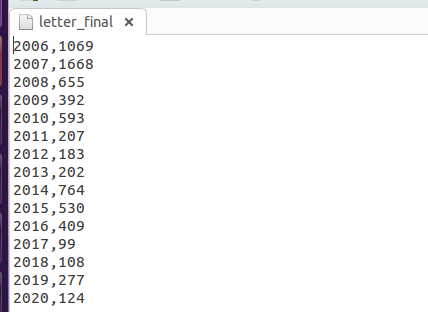
格式为:(以逗号间隔,方便存入mysql)
输入代码:
LOAD DATA INFILE '/var/lib/mysql-files/letter_final' INTO TABLE letter fields terminated by ',';

然后我们创建web,开始进行可视化。
图表的html代码:
<%@ page language="java" contentType="text/html; charset=UTF-8"
    pageEncoding="UTF-8"%>
<!DOCTYPE html PUBLIC "-//W3C//DTD HTML 4.01 Transitional//EN" "http://www.w3.org/TR/html4/loose.dtd">
<html>
<head>
<meta http-equiv="Content-Type" content="text/html; charset=UTF-8">
<title>Insert title here</title>
<script src="https://cdn.staticfile.org/echarts/4.3.0/echarts.min.js"></script>
<script src="js/jquery-1.5.1.js"></script>
</head>
<body>
<div id="main" style="width: 1000px;height:400px;background-color:white;"></div>
<script type="text/javascript">
var myChart = echarts.init(document.getElementById('main'));
myChart.showLoading();
//6.ajax发起数据请求
var nums = []; //建立一个销量数组(实际用来盛放Y坐标值)
var names = []; //建立一个销量数组(实际用来盛放Y坐标值)
$.ajax({
    type : "post",
    async : true, //异步请求(同步请求将会锁住浏览器,其他操作须等请求完成才可执行)
    url : "servlet?method=find2", //请求发送到TestServlet
    data : {},
    dataType : "json", //返回数据形式为json

    //7.请求成功后接收数据name+num两组数据
    success : function(result) {
        //result为服务器返回的json对象
        if (result) {
            //8.取出数据存入数组
            //alert(result.length);
            for (var i = 0; i < result.length; i++) {
                nums.push(result[i].num); //迭代取出类别数据并填入类别数组
                names.push(result[i].year);
            }
            //alert(nums);
            myChart.hideLoading();

option = {
	    xAxis: {
	        type: 'category',
	        data: names
	    },
	    yAxis: {
	        type: 'value'
	    },
	    series: [{
	        data: nums,
	        type: 'bar'
	    }]
	};
myChart.setOption(option, true);
        }}})
</script>
</body>
</html>
dao层:
package com.letter.dao;
import java.sql.Connection;
import java.sql.DriverManager;
import java.sql.ResultSet;
import java.sql.Statement;
import java.util.ArrayList;
import java.util.List;

import com.letter.entity.entity;;
public class dao {
	public List<entity> list1()
	{
		int sum=0;
		   List<entity> list =new ArrayList<entity>();
	        try {
	            // 加载数据库驱动,注册到驱动管理器
	            Class.forName("com.mysql.jdbc.Driver");
	            // 数据库连接字符串
	            String url = "jdbc:mysql://localhost:3306/mysql?useUnicode=true&characterEncoding=utf-8";
	            // 数据库用户名
	            String username = "root";
	            // 数据库密码
	            String password = "";
	            // 创建Connection连接
	            Connection conn = DriverManager.getConnection(url, username,
	                    password);
	            // 添加图书信息的SQL语句
	            String sql = "select * from letter";
	            // 获取Statement
	            Statement statement = conn.createStatement();

	            ResultSet resultSet = statement.executeQuery(sql);
	            while (resultSet.next()) {
                   entity book = new entity();
                	   //sum=sum+resultSet.getInt("round");
                   book.setYear(resultSet.getString("year"));
                   book.setNum(resultSet.getInt("Num"));
   	                list.add(book);
	            }
	            resultSet.close();
	            statement.close();
	            conn.close();
	}catch (Exception e) {
	    e.printStackTrace();
	}
	        return list;
}
}
servlet代码:
package com.letter.servlet;

import java.io.IOException;
import java.util.ArrayList;
import java.util.List;

import javax.servlet.ServletException;
import javax.servlet.annotation.WebServlet;
import javax.servlet.http.HttpServlet;
import javax.servlet.http.HttpServletRequest;
import javax.servlet.http.HttpServletResponse;
import javax.servlet.http.HttpSession;

import com.google.gson.Gson;
import com.letter.entity.entity;
import com.letter.dao.*;
/**
 * Servlet implementation class servlet
 */
@WebServlet("/servlet")
public class servlet extends HttpServlet {
	private static final long serialVersionUID = 1L;

    /**
     * @see HttpServlet#HttpServlet()
     */
    public servlet() {
        super();
        // TODO Auto-generated constructor stub
    }
dao dao1=new dao();
	/**
	 * @see HttpServlet#doGet(HttpServletRequest request, HttpServletResponse response)
	 */
    protected void service(HttpServletRequest request, HttpServletResponse response) throws ServletException, IOException {
		request.setCharacterEncoding("utf-8");
		String method=request.getParameter("method");
		if("view".equals(method))
		{
			view(request, response);
		}else if("find2".equals(method))
		{
			find2(request, response);
		}
    }
    private void view(HttpServletRequest request, HttpServletResponse response) throws IOException, ServletException {
  		request.setCharacterEncoding("utf-8");
  		String buy_nbr=request.getParameter("buy_nbr");
		HttpSession session=request.getSession();
       	session.setAttribute("userInfo", buy_nbr);
  	request.getRequestDispatcher("left.jsp").forward(request, response);
      }

    private void find2(HttpServletRequest request, HttpServletResponse response) throws IOException, ServletException {
  		request.setCharacterEncoding("utf-8");
  		 List<entity> list =new ArrayList<entity>();
  		HttpSession session=request.getSession();
		String buy_nbr=(String) session.getAttribute("userInfo");
  		 entity book = new entity();
  		List<entity> list2=dao1.list1();
  		System.out.println(list2.size());
//  		String buy_nbr=(String) session.getAttribute("userInfo");
//  		System.out.println(buy_nbr);
  		Gson gson2 = new Gson();
        String json = gson2.toJson(list2);
       // System.out.println(json);
       // System.out.println(json.parse);
	 response.setContentType("textml; charset=utf-8");
        response.getWriter().write(json);

      }
}
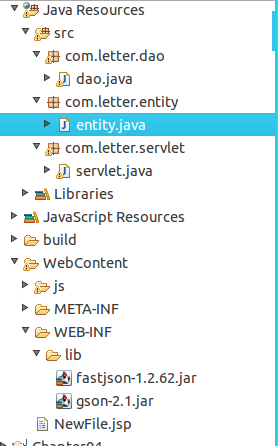
架构:
运行结果:
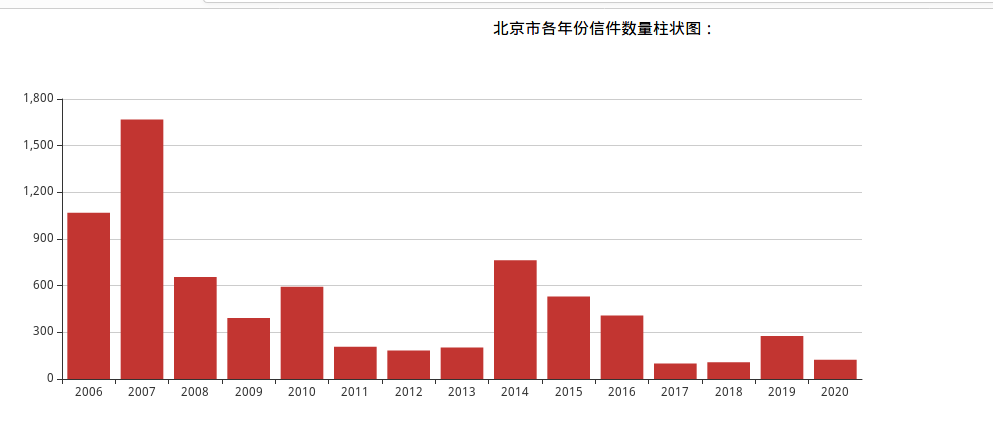
那么就完整的展现出来了从网站分析爬取----》数据清洗----》数据可视化。
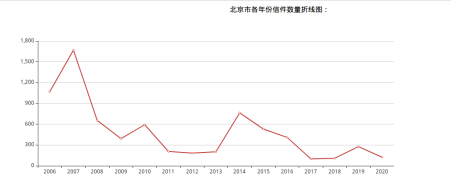
后面我又做了一些改动:
折线图:
<%@ page language="java" contentType="text/html; charset=UTF-8"
    pageEncoding="UTF-8"%>
<!DOCTYPE html PUBLIC "-//W3C//DTD HTML 4.01 Transitional//EN" "http://www.w3.org/TR/html4/loose.dtd">
<html>
<head>
<meta http-equiv="Content-Type" content="text/html; charset=UTF-8">
<title>Insert title here</title>
<script src="https://cdn.staticfile.org/echarts/4.3.0/echarts.min.js"></script>
<script src="js/jquery-1.5.1.js"></script>
</head>
<body>
<center><h>北京市各年份信件数量折线图:</h></center>
<div id="main" style="width: 1000px;height:400px;background-color:white;"></div>
<script type="text/javascript">
var myChart = echarts.init(document.getElementById('main'));
myChart.showLoading();
//6.ajax发起数据请求
var nums = []; //建立一个销量数组(实际用来盛放Y坐标值)
var names = []; //建立一个销量数组(实际用来盛放Y坐标值)
$.ajax({
    type : "post",
    async : true, //异步请求(同步请求将会锁住浏览器,其他操作须等请求完成才可执行)
    url : "servlet?method=find2", //请求发送到TestServlet
    data : {},
    dataType : "json", //返回数据形式为json

    //7.请求成功后接收数据name+num两组数据
    success : function(result) {
        //result为服务器返回的json对象
        if (result) {
            //8.取出数据存入数组
            //alert(result.length);
            for (var i = 0; i < result.length; i++) {
                nums.push(result[i].num); //迭代取出类别数据并填入类别数组
                names.push(result[i].year);
            }
            //alert(nums);
            myChart.hideLoading();

            option = {
            	    xAxis: {
            	        type: 'category',
            	        data: names
            	    },
            	    yAxis: {
            	        type: 'value'
            	    },
            	    series: [{
            	        data: nums,
            	        type: 'line'
            	    }]
            	};
myChart.setOption(option, true);
        }}})
</script>
</body>
</html>
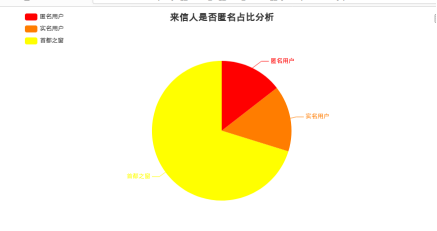
//圆饼图:
<%@ page language="java" contentType="text/html; charset=UTF-8"
    pageEncoding="UTF-8"%>
<!DOCTYPE html PUBLIC "-//W3C//DTD HTML 4.01 Transitional//EN" "http://www.w3.org/TR/html4/loose.dtd">
<%@page import="java.util.List"%>
<%@page import="com.letter.entity.entity"%>
<html>
<head>
<meta http-equiv="Content-Type" content="text/html; charset=UTF-8">
<title>Insert title here</title>
<script src="https://cdn.staticfile.org/echarts/4.3.0/echarts.min.js"></script>
<script src="js/jquery-1.5.1.js"></script>
</head>
<body>
 <div id="main" style="width: 1000px;height:400px;"></div>
<script type="text/javascript">
        // based on prepared DOM, initialize echarts instance

        var myChart = echarts.init(document.getElementById('main'));

        // specify chart configuration item and data
 	myChart.setOption({
               title : {
                    text: '来信人是否匿名占比分析',
                    //subtext: '纯属虚构',
                    x:'center'
                },
                tooltip : {
                    trigger: 'item',
                    formatter: "{a} <br/>{b} : {c} ({d}%)"
                },
                legend: {
                    orient : 'vertical',
                    x : 'left',
                    data:[]
                },
                toolbox: {
                    show : true,
                    feature : {
                        mark : {show: true},
                        dataView : {show: true, readOnly: false},
                        magicType : {
                            show: true,
                            type: ['pie', 'funnel'],
                            option: {
                                funnel: {
                                    x: '25%',
                                    width: '50%',
                                    funnelAlign: 'left',
                                    max: 1548
                                }
                            }
                        },
                        restore : {show: true},
                        saveAsImage : {show: true}
                    }
                },
                calculable : true,
                series : [
                    {
                        name:'来信人分析',
                        type:'pie',
                        radius : '65%',
                        center: ['50%', '60%'],
                        data:[]
                    }
                ]
        });

        //4.设置加载动画(非必须)
        myChart.showLoading(); //数据加载完之前先显示一段简单的loading动画

        //5.定义数据存放数组(动态变)
        var statisticsData = [];   //这是我自己建的空数组,为了把异步拿到的数据push进去
        var statisticsName = [];
        //6.ajax发起数据请求
        $.ajax({
            type : "post",
            async : true, //异步请求(同步请求将会锁住浏览器,其他操作须等请求完成才可执行)
            url : "servlet?method=find", //请求发送到Servlet
            data : {},
            dataType : "json", //返回数据形式为json

            //7.请求成功后接收数据name+num两组数据
            success : function(result) {
                //result为服务器返回的json对象
                if (result) {
                    //8.取出数据存入数组
                    for (var i = 0; i < result.length; i++) {
                        var statisticsObj = {name:'',value:''};   //因为ECharts里边需要的的数据格式是这样的
                        statisticsObj.name = result[i].people;
                        statisticsName.push(result[i].people);
                        statisticsObj.value = result[i].num;
                        statisticsData.push(statisticsObj);   //把拿到的异步数据push进我自己建的数组里
                    }

                    myChart.hideLoading(); //隐藏加载动画

                    //9.覆盖操作-根据数据加载数据图表
                    myChart.setOption({
                        legend: {
                            show: true,
                            x: '10%',
                            data: statisticsName //这里是图表上的数据
                        },
                        series: [{
                            name: '股权分析',
                            type: 'pie',
                            radius : '70%',
                            center: ['50%', '60%'],
                            data: statisticsData,    //这里是异步加载系列列表

                            itemStyle: {
                                normal: {
                                    color: function(params) {
                                        // build a color map as your need.
                                        var colorList = [
                                          '#FF0000','#FF7D00','#FFFF00','#00FF00','#00FFFF',
                                           '#0000FF','#FF00FF','#FAD860','#F3A43B','#60C0DD',
                                           '#D7504B','#C6E579','#F4E001','#F0805A','#26C0C0'
                                        ];
                                        return colorList[params.dataIndex];
                                    },
                                }
                            },


                        }]
                    });
                }
            },
            error : function(errorMsg) {
                //请求失败时执行该函数
                alert("图表请求数据失败!");
                myChart.hideLoading();
            }
        })
    </script>
</body>
</html>
最后截图:


 浙公网安备 33010602011771号