Memory Analyzer Blog
引用:http://memoryanalyzer.blogspot.jp/2008/05/automated-heap-dump-analysis-finding.html
Dienstag, 27. Mai 2008
Automated Heap Dump Analysis: Finding Memory Leaks with One Click
There is a common understanding that a single snapshot of the Java heap is not enough for finding a memory leak. The usual approach is to search for a monotonous increase of the number of objects of some class by “online” profiling/monitoring or by comparing a series of snapshots made over time. However, such a “live” monitoring is not always possible, and is especially difficult to be performed in productive systems because of the performance costs of using a profiler, and because of the fact that some leaks show themselves only rarely, when certain conditions have appeared.
In this blog will try to show that analysis based on a single heap dump can also be an extremely powerful means of finding memory leaks. I will give some tips how to obtain data suitable for the analysis. I will then describe how to use the automated analysis features of the Memory Analyzer tool, which was contributed several months ago to Eclipse. Automating the analysis greatly reduces the complexity of finding memory problems, and enables even non-experts to handle memory-related issues. All you need to do is provide a good heap dump, and click once to trigger the analysis. The Memory Analyzer will create for you a report with the leak suspects. What this report contains, and how the reported leak suspects are found is described below.
Preparation
The first thing to do before starting with the analysis is to collect enough data for it. This is fairly easy - one can configure the JVM to write a heap dump whenever an OutOfMemoryError occurs. Having this setup will ensure that you get the data without having to observe the system the whole time and wait for the proper moment to trigger the dump on your own. How to configure the VM is described here (in a nutshell: add the option -XX:+HeapDumpOnOutOfMemoryError).
The second step of the preparation is to enable the memory leak to become more visible and easily detectable. To achieve this one can use the following trick: configure the maximum size of the Java heap to be much higher than the heap used when the application is running correctly (for example set it to twice the size which is usually left after a full GC). Even if you don’t know how much memory the application really needs, increasing the heap is not a bad idea (it may turn out that there is no leak but simply more heap is required). I don’t want to go into discussions if running Java applications with too big heaps is a good approach in general - simply use the tip for the time of the troubleshooting.
What do you gain by this change? On the first OutOfMemoryError the VM will write a heap dump. Most likely the size of the objects related to the leak in this heap dump will be about the half of the total heap size, i.e. it should be relatively easy to detect the leak later.
Executing the Report
Now imagine you have the heap dump which was produced by the VM as the OutOfMemoryError reoccurred. It is time to begin the leak hunting. Start the Memory Analyzer tool and load the heap dump. Already after opening the heap dump, you see an info page with a chart of the biggest objects, and in many cases you will notice a single huge object already here.
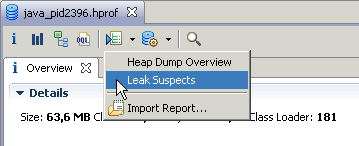
But this is not the leak suspects report yet. The report, as I promised, is executed by a single click – on the “Leak Suspects” link of the overview:

Alternatively, one can execute the report using the menu from the tool bar, but it takes two clicks then ;-)

This is all you need to do. Behind the scenes we use several of the features available in the tool, and try to figure out suspiciously big objects or sets of objects. Then the findings are summarized in a comprehensive, though easy to understand HTML report. The HTML report will be displayed in the tool after it is generated. At the same time, it will be also persisted in a zip file next to the heap dump file that was provided. Thus it is very easy to ask colleagues to have a look at a specific problem, just passing them the several-kilobytes-big report, instead of transferring the whole (potentially gigabytes big) heap dump.
Content of the Report – Suspects Overview
Now let’s have a look at such a report which I have generated. As an example I have used a sample Eclipse plug-in which models a memory-leak. I called it "org.eclipse.mat.demo.leak".
This is the result I see when I do the one-click described above.

The first thing that catches my attention is a pie chart, which gives me a good visual impression about the size the suspect (the darker color). I can easily see that for my example it is about 3/4 from the whole heap.
Then follows a short description, which tells me that one instance of my LeakingQueue class, loaded by "org.eclipse.mat.demo.leak" occupies 53Mb, or 80% of the heap.
It tells me also that the memory is piled up in an instance of Object[].
So, with just two sentences the report gives me a very short and meaningful explanation where the problem is – the name of the class keeping the memory, the component to which this class belongs, how much memory is kept, and where exactly the memory is accumulated.
Note: Here the component "org.eclipse.mat.demo.leak" is actually the name of my plug-in extracted from the ClassLoader that loaded it. This is a very handy info, as even in this relatively small heap dump, there were 181 different plug-ins/classloaders. Extracting the name makes the explanation much more helpful and intuitive to understand.
Then the report offers me a set of keywords. What are they good for? One of the goals we have set for the report was to enable the discovery of already known problems. Therefore we needed to provide for each suspect a unique identifier, which people can use and search for the problem against an existing bug-tracking system. All keywords in the report (when used together) are this identifier. If the one who initially encountered the problem has provided this keywords in a bug-report, then others that encounter the same problem and use the keywords to search for a solution, should be able to find it.
Good. So far I was able with one click to see a problem suspect, and to get some info which allows me to search for a known solution. This would enable me to react on this concrete problem, even if I were not the owner of the coding, even if I didn't have any experience with troubleshooting memory-related problems.
Content of the Report – Details about the Problem
Besides an overview of the leak suspects, the report contains detailed information about each of the suspects. You can display it by following the “details” link. What details are available? Well, while looking at many different real-life problems, we found that two questions usually arise when a leak suspect is found:
Therefore, we tried to pack the answers to these two questions in the report. First, you will find in the details the shortest path from a GC root to the accumulation point:

Here you can see all the classes and fields through which the reference chain goes, and if you are familiar with the coding they should give you a good understanding how the objects are held.
Then (to answer the question why is the suspect so big) the report contains some information about the content which was accumulated:


Here, one can see which objects have been piled up - in my example these are two different types of events kept by the queue.
Content of the Report – System Overview
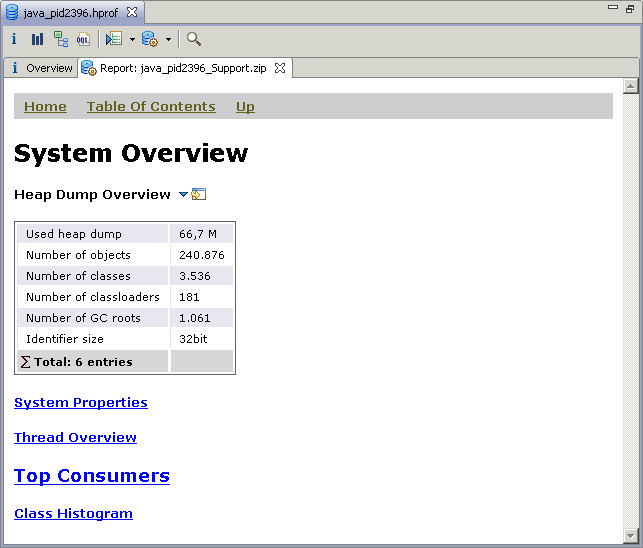
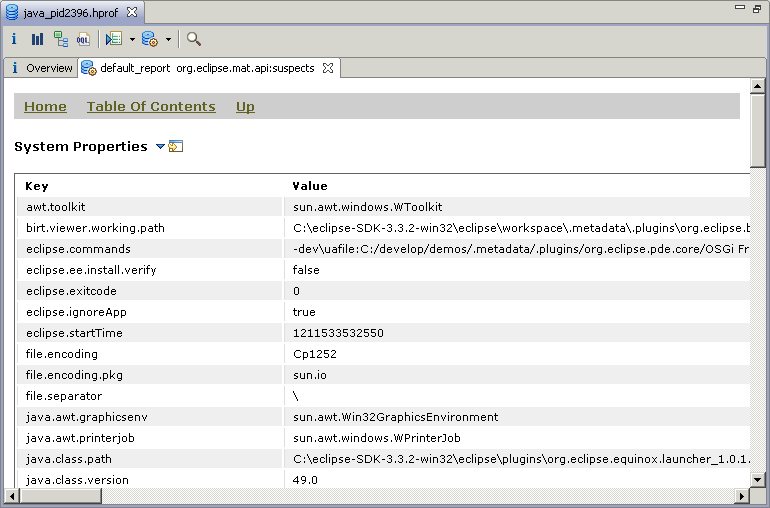
Now that we have a detailed description of the problem, let's look at one more part of the reports - the "System Overview". Once a problem is identified, questions like “In what context did this problem appear?" or "What was the environment?” may arise. To give the answer to such questions, we pack into each report a "System Overview" page. This page contains a collection of different details extracted from the heap dump, that can help you better understand the context in which the problem has appeared. These details include:
Here are two screenshots from my example - the "System Overview" start page and the "System Properties".


Behind the Scenes - Finding the Leak Suspect
Let me try now to explain how we actually find the leak suspects. When the heap dump is opened for the first time, we create several index files next to it, which enable us to access the data efficiently afterwards. During the first parsing we also build a dominator tree out of the object graph. And namely this dominator tree plays the most important role later, when we do the analysis and search for the suspects. It is difficult to explain the graph theory behind the dominator tree on a few lines only, therefore I will try to list the most important things we gain from using it:
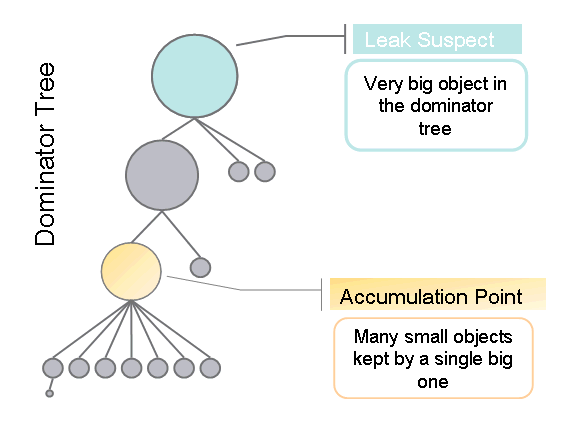
Let me now explain how we use the dominator tree to find the leak suspects. Look at the following figure. It presents a part of the dominator tree and the size of the circles represents the retained size of the objects: the bigger the circle, the bigger the object.

We simply treat all objects with size over a certain threshold as suspects. Then we go down the dominator tree and try to reach an object all of whose children are significantly smaller in size. This is what we call the "accumulation point". Then we just take these two objects - the suspect and the accumulation point - and use them to describe the problem.
Some more information and a description how to perform the leak hunting manually could be found in my older blog. It is based on a different version of the tool (before it became an Eclipse project) and therefore some of the buttons differ. Nevertheless, I think the explanation may help you to understand better the content of the current blog.
Conclusion
I still think that both "online" profiling and "off-line" analysis of snapshots have their strengths and limitations. I hope that I was able to demonstrate that the heap dump based memory analysis could be extremely helpful for finding memory leaks (powered by the Memory Analyzer ;-) ). Some of its advantages - no performance cost during runtime, heap dumps automatically provided by the VM on OutOfMemoryError, simplicity coming from the automated analysis - make this approach my preferred one, especially for troubleshooting productive systems.
Your feedback is highly appreciated!
Krum


 浙公网安备 33010602011771号