
柱状图
问题1:
for m, n in zip(x1, y1):
    plt.text(m + 0.08, n + 20, '%.2f' % n, ha='center', va='bottom')

for m, n in zip(x2, y2):
    plt.text(m - 0.08, n + 10, '%.2f' % n, ha='center', va='bottom')
问题2:
如果是三个图怎么办

0.5:柱状图的宽度
align:对齐方式
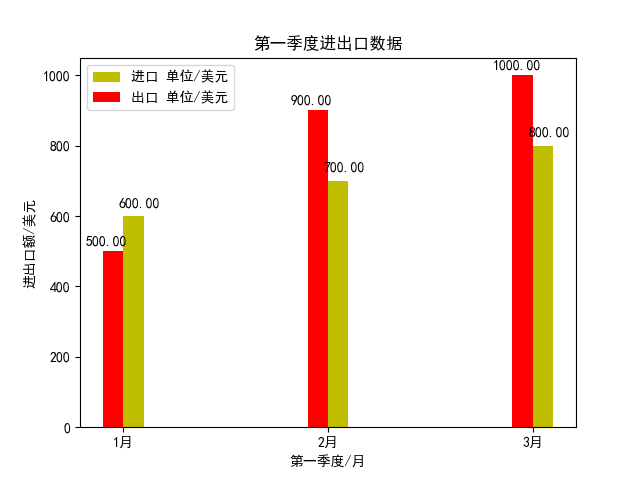
x1=[1,2,3]
x2=[1,2,3]
y1=[600,700,800]
y2=[500,900,1000]

plt.figure()
plt.bar(x1,y1,0.1,color='y',align='edge',label='进口 单位/美元')
plt.bar(x2,y2,-0.1,color='r',align='edge',label='出口 单位/美元')

for m, n in zip(x1, y1):
    plt.text(m + 0.08, n + 20, '%.2f' % n, ha='center', va='bottom')

for m, n in zip(x2, y2):
    plt.text(m - 0.08, n + 10, '%.2f' % n, ha='center', va='bottom')

plt.xlabel('第一季度/月')
plt.ylabel('进出口额/美元')
plt.title('第一季度进出口数据')
plt.xticks(range(1,4),[str(i)+'月' for i in range(1,4)])
plt.legend()
plt.show()
adding
1.按到Insert会出现想命令行一样的输入形式
2.打开ipynb文件,将文件移到jupyter下就可以打开了
