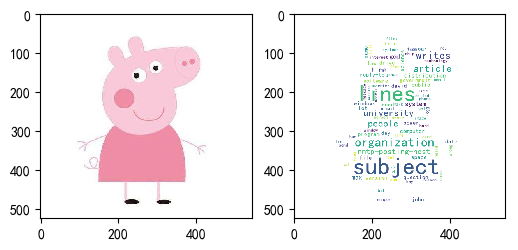
python 绘制词云图
1. 先下载并安装nltk包,准备一张简单的图片存入代码所在文件目录,搜集英文停用词表
import nltk
nltk.download()
2. 绘制词云图
import re
import numpy as np
import pandas as pd
#import matplotlib
import matplotlib.pyplot as plt
from nltk.tokenize import word_tokenize, sent_tokenize
from nltk.corpus import stopwords
from PIL import Image
from wordcloud import WordCloud
from sklearn.datasets import fetch_20newsgroups
#from sklearn.feature_extraction.text import CountVectorizer
from collections import Counter, defaultdict

def word_cut(contents, cut=','):
    res = []
    for content in contents:
        content = content.lower()
        words = [word for word in re.split(cut, content) if word]
        res.append(words)
    return res

def word_count(contents):
    #words_count = Counter(sum(contents,[]))  #慢
    word_count_dict = defaultdict(lambda: 0)
    for content in contents:
        temp_dict = Counter(content)
        for key in temp_dict:
            word_count_dict[key] += temp_dict[key]
    return word_count_dict

def stopwords_filter(contents, stopwords):
    contents_clean = []
    word_count_dict = defaultdict(lambda: 0)
    for line in contents:
        line_clean = []
        for word in line:
            if word in stopwords:
                continue
            line_clean.append(word)
            word_count_dict[word] += 1
        contents_clean.append(line_clean)

    words_count = list(word_count_dict.items())
    words_count.sort(key=lambda x:-x[1])
    words_count = pd.DataFrame(words_count, columns=['word', 'count'])
    return contents_clean, words_count

# 从外部导入数据
'''
df_news = pd.read_table('val.txt', names=['category','theme','URL','content'], encoding='utf-8')
stopwords = pd.read_csv("stopwords.txt", index_col = False, sep="\t",
                        quoting=3, names=['stopword'], encoding='utf-8')
contents = df_news.content.values.tolist()
stopwords = stopwords.stopword.values.tolist()'''

# 自定义切词
'''
#[ ,.\n\t--\':;?!/+<>@]
#[ ,.\n\t=--\'`_\[\]:;?!^/|+<>{}@~\\]
#contents = word_cut(contents=news.data, cut='[ ,.\n\t-\`_\[\]:;?!\^/|+<>{}@~]')
'''
# 将数据整理为模型入参形式
'''
#vec = CountVectorizer()
#X_train = vec.fit_transform(X_train)  #不可直接将vec用在测试集上
#vectorizer_test = CountVectorizer(vocabulary=vec.vocabulary_)
#X_test = vectorizer_test.transform(X_test)
'''

# 可从中筛选停用词
'''
word_count_dict = word_count(contents)
temp = list(word_count_dict.items())
temp.sort(key=lambda x:-x[1])
df = pd.DataFrame(temp, columns=['word','count'])
df.to_csv(r'D:\PycharmProjects\zsyb\stop_words.csv')
'''

# 调包实现上述功能
news = fetch_20newsgroups(subset='all')
# 自定义的快好几倍,可以加if not in ‘’去标点
contents = [word_tokenize(content.lower()) for content in news.data]  #sent_tokenize(content)
punctuations = set(list(',.\n\t-\`_()\[\]:;?!$#%&.*=\^/|+<>{}@~'))  #标点
digits = {str(i) for i in range(50)}
others = {'--', "''", '``', "'", '...'}
# 下载网上的停用词表加入 nltk_data\corpora\stopwords,低频词过滤(不要加入停用词)
stopWords = set(stopwords.words('english')) | punctuations | digits | others
contents_clean, words_count = stopwords_filter(contents, stopWords)
#df.groupby(by=['word']).agg({"count": np.size})

# 绘制词云图
fontpath = 'simhei.ttf'
aimask = np.array(Image.open(r"D:\PycharmProjects\zsyb\pig.png"))

wc = WordCloud(font_path = fontpath,          #设置字体
               background_color = "white",    #背景颜色
               max_words = 1000,              #词云显示的最大词数
               max_font_size = 100,           #字体最大值
               min_font_size = 10,            #字体最小值
               random_state = 42,             #随机数
               collocations = False,          #避免重复单词
               mask = aimask,                 #造型遮盖
               width = 1200, height = 800,    #图像宽高,需配合plt.figure(dpi=xx)放缩才有效
               margin = 2                     #字间距
               )
word_frequence = {x[0]:x[1] for x in words_count.head(100).values}
word_cloud=wc.fit_words(word_frequence)

plt.figure(dpi=100) #通过这里可以放大或缩小
plt.subplot(121)
plt.imshow(aimask)
#plt.axis("off")  #隐藏坐标
plt.subplot(122)
plt.imshow(word_cloud)
#plt.axis("off")  #隐藏坐标


