Html 中 通过 原生 Js 与 jQuery 使用本地 JSON 文件的数据
方式一:JSON 数据存放在外部 Js 文件或 <script></script> 标签内一个变量内,引入 JS 文件后,直接使用其变量名即可;
参考网址:https://blog.csdn.net/james_laughing/article/details/89460335


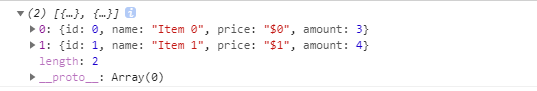
// 将 jsonStr 放在外部 js 文件内 ,或 <script></script> 标签内
var jsonStr = [
  {
      "id": 0,
      "name": "Item 0",
      "price": "$0",
      "amount": 3
  },
  {
      "id": 1,
      "name": "Item 1",
      "price": "$1",
      "amount": 4
  }
]

// 使用时,直接通过 jsonStr 使用即可
预览如下 :
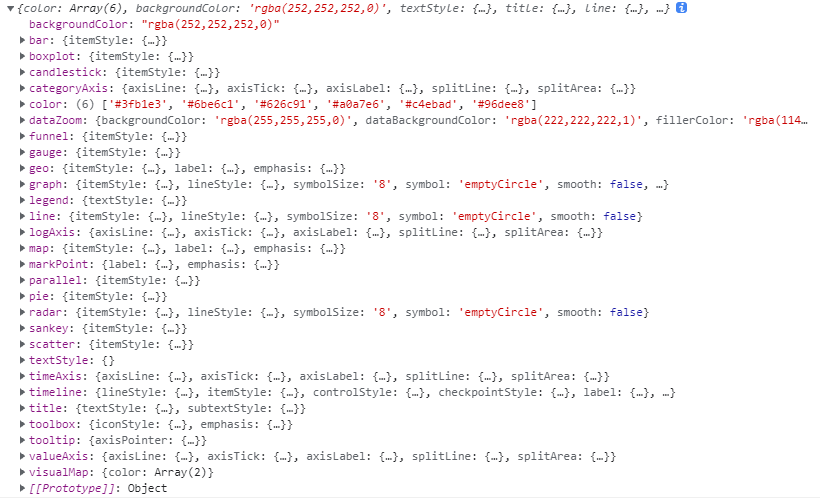
    var xmlhttp = new XMLHttpRequest();
    var url = "theme/walden.json";
    xmlhttp.onreadystatechange = function () {
      if (xmlhttp.readyState == 4 && xmlhttp.status == 200) {
        var myArr = JSON.parse(xmlhttp.responseText); // 这里便是获取到的 json 数据
        myFunction(myArr); //
      }
    }
    xmlhttp.open("GET", url, true);
    xmlhttp.send();
    function myFunction(arr) {
      console.log(arr); // 这里控制台打印获取到的 json 数据
    }
预览如下:
方式三:使用 jQuery 的 $.ajax() 获取,请求方式:GET
参考网址:https://www.cnblogs.com/yadongliang/p/9649529.html
// 因为在做 echarts 自定义主题的相关练习,此处的引用 json 即是 echarts 主题编辑器导出的 主题 json 文件

    var dom = document.getElementById("charts");

    // 1. 引入 JSON ,这里是 jQuery 的方式请求本地文件 json 数据
    var obj=null;
    $.ajax({
      type: 'GET',
      url: 'theme/walden.json',
      async: false,  // 此处通过同步请求的方式,避免 obj 赋值异常
      data: {},
      success: function (res) {
        // res 为获取到的 json 数据
        console.log(res);
        obj = res;
      },
      error: function (err) {
        console.log(err);
      }
    });

    // 2.将 JSON 内容转换为对象  如果已经是对象,无须再转
    // var obj = JSON.parse(data);
    // console.log(obj);

    // 3. 调用 echarts.registerTheme('walden',obj); 注册主题
    echarts.registerTheme('walden', obj);
    // 4. 实例化 图表时 使用主题
    var charts = echarts.init(dom, 'walden');

    var option = {
      xAxis: {
        data: week,
      },
      yAxis: {},
      // backgroundColor: "#f5f5f5",
      // color: color, // 全局范围设置颜色。如果不止一种颜色,若少于所需范围,则自动使用默认颜色补足;若超出所需范围,则不使用;
      series: [{
        type: 'pie',
        data: pieData,
        radius: '16%',
        center: ["35%", 60],
        // color: seriesColor[1] // 单独设置某个 series【系统】 的颜色
      }, {
        type: 'bar',
        data: bar,
        // color: seriesColor[0],
      }]
    };

    charts.setOption(option);
方式二与方式三使用同一个 json 文件,预览同方式二。
附上文中使用的本地 JSON 数据
{
    "color":[
      "#3fb1e3","#6be6c1","#626c91","#a0a7e6","#c4ebad","#96dee8"
    ],
    "backgroundColor": "rgba(252,252,252,0)",
    "textStyle": {},
    "title": {
        "textStyle": {
            "color": "#666666"
        },
        "subtextStyle": {
            "color": "#999999"
        }
    },
    "line": {
        "itemStyle": {
            "borderWidth": "2"
        },
        "lineStyle": {
            "width": "3"
        },
        "symbolSize": "8",
        "symbol": "emptyCircle",
        "smooth": false
    },
    "radar": {
        "itemStyle": {
            "borderWidth": "2"
        },
        "lineStyle": {
            "width": "3"
        },
        "symbolSize": "8",
        "symbol": "emptyCircle",
        "smooth": false
    },
    "bar": {
        "itemStyle": {
            "barBorderWidth": 0,
            "barBorderColor": "#ccc"
        }
    },
    "pie": {
        "itemStyle": {
            "borderWidth": 0,
            "borderColor": "#ccc"
        }
    },
    "scatter": {
        "itemStyle": {
            "borderWidth": 0,
            "borderColor": "#ccc"
        }
    },
    "boxplot": {
        "itemStyle": {
            "borderWidth": 0,
            "borderColor": "#ccc"
        }
    },
    "parallel": {
        "itemStyle": {
            "borderWidth": 0,
            "borderColor": "#ccc"
        }
    },
    "sankey": {
        "itemStyle": {
            "borderWidth": 0,
            "borderColor": "#ccc"
        }
    },
    "funnel": {
        "itemStyle": {
            "borderWidth": 0,
            "borderColor": "#ccc"
        }
    },
    "gauge": {
        "itemStyle": {
            "borderWidth": 0,
            "borderColor": "#ccc"
        }
    },
    "candlestick": {
        "itemStyle": {
            "color": "#e6a0d2",
            "color0": "transparent",
            "borderColor": "#e6a0d2",
            "borderColor0": "#3fb1e3",
            "borderWidth": "2"
        }
    },
    "graph": {
        "itemStyle": {
            "borderWidth": 0,
            "borderColor": "#ccc"
        },
        "lineStyle": {
            "width": "1",
            "color": "#cccccc"
        },
        "symbolSize": "8",
        "symbol": "emptyCircle",
        "smooth": false,
        "color": [
            "#3fb1e3",
            "#6be6c1",
            "#626c91",
            "#a0a7e6",
            "#c4ebad",
            "#96dee8"
        ],
        "label": {
            "color": "#ffffff"
        }
    },
    "map": {
        "itemStyle": {
            "areaColor": "#eeeeee",
            "borderColor": "#aaaaaa",
            "borderWidth": 0.5
        },
        "label": {
            "color": "#ffffff"
        },
        "emphasis": {
            "itemStyle": {
                "areaColor": "rgba(63,177,227,0.25)",
                "borderColor": "#3fb1e3",
                "borderWidth": 1
            },
            "label": {
                "color": "#3fb1e3"
            }
        }
    },
    "geo": {
        "itemStyle": {
            "areaColor": "#eeeeee",
            "borderColor": "#aaaaaa",
            "borderWidth": 0.5
        },
        "label": {
            "color": "#ffffff"
        },
        "emphasis": {
            "itemStyle": {
                "areaColor": "rgba(63,177,227,0.25)",
                "borderColor": "#3fb1e3",
                "borderWidth": 1
            },
            "label": {
                "color": "#3fb1e3"
            }
        }
    },
    "categoryAxis": {
        "axisLine": {
            "show": true,
            "lineStyle": {
                "color": "#cccccc"
            }
        },
        "axisTick": {
            "show": false,
            "lineStyle": {
                "color": "#333"
            }
        },
        "axisLabel": {
            "show": true,
            "color": "#999999"
        },
        "splitLine": {
            "show": true,
            "lineStyle": {
                "color": [
                    "#eeeeee"
                ]
            }
        },
        "splitArea": {
            "show": false,
            "areaStyle": {
                "color": [
                    "rgba(250,250,250,0.05)",
                    "rgba(200,200,200,0.02)"
                ]
            }
        }
    },
    "valueAxis": {
        "axisLine": {
            "show": true,
            "lineStyle": {
                "color": "#cccccc"
            }
        },
        "axisTick": {
            "show": false,
            "lineStyle": {
                "color": "#333"
            }
        },
        "axisLabel": {
            "show": true,
            "color": "#999999"
        },
        "splitLine": {
            "show": true,
            "lineStyle": {
                "color": [
                    "#eeeeee"
                ]
            }
        },
        "splitArea": {
            "show": false,
            "areaStyle": {
                "color": [
                    "rgba(250,250,250,0.05)",
                    "rgba(200,200,200,0.02)"
                ]
            }
        }
    },
    "logAxis": {
        "axisLine": {
            "show": true,
            "lineStyle": {
                "color": "#cccccc"
            }
        },
        "axisTick": {
            "show": false,
            "lineStyle": {
                "color": "#333"
            }
        },
        "axisLabel": {
            "show": true,
            "color": "#999999"
        },
        "splitLine": {
            "show": true,
            "lineStyle": {
                "color": [
                    "#eeeeee"
                ]
            }
        },
        "splitArea": {
            "show": false,
            "areaStyle": {
                "color": [
                    "rgba(250,250,250,0.05)",
                    "rgba(200,200,200,0.02)"
                ]
            }
        }
    },
    "timeAxis": {
        "axisLine": {
            "show": true,
            "lineStyle": {
                "color": "#cccccc"
            }
        },
        "axisTick": {
            "show": false,
            "lineStyle": {
                "color": "#333"
            }
        },
        "axisLabel": {
            "show": true,
            "color": "#999999"
        },
        "splitLine": {
            "show": true,
            "lineStyle": {
                "color": [
                    "#eeeeee"
                ]
            }
        },
        "splitArea": {
            "show": false,
            "areaStyle": {
                "color": [
                    "rgba(250,250,250,0.05)",
                    "rgba(200,200,200,0.02)"
                ]
            }
        }
    },
    "toolbox": {
        "iconStyle": {
            "borderColor": "#999999"
        },
        "emphasis": {
            "iconStyle": {
                "borderColor": "#666666"
            }
        }
    },
    "legend": {
        "textStyle": {
            "color": "#999999"
        }
    },
    "tooltip": {
        "axisPointer": {
            "lineStyle": {
                "color": "#cccccc",
                "width": 1
            },
            "crossStyle": {
                "color": "#cccccc",
                "width": 1
            }
        }
    },
    "timeline": {
        "lineStyle": {
            "color": "#626c91",
            "width": 1
        },
        "itemStyle": {
            "color": "#626c91",
            "borderWidth": 1
        },
        "controlStyle": {
            "color": "#626c91",
            "borderColor": "#626c91",
            "borderWidth": 0.5
        },
        "checkpointStyle": {
            "color": "#3fb1e3",
            "borderColor": "#3fb1e3"
        },
        "label": {
            "color": "#626c91"
        },
        "emphasis": {
            "itemStyle": {
                "color": "#626c91"
            },
            "controlStyle": {
                "color": "#626c91",
                "borderColor": "#626c91",
                "borderWidth": 0.5
            },
            "label": {
                "color": "#626c91"
            }
        }
    },
    "visualMap": {
        "color": [
            "#2a99c9",
            "#afe8ff"
        ]
    },
    "dataZoom": {
        "backgroundColor": "rgba(255,255,255,0)",
        "dataBackgroundColor": "rgba(222,222,222,1)",
        "fillerColor": "rgba(114,230,212,0.25)",
        "handleColor": "#cccccc",
        "handleSize": "100%",
        "textStyle": {
            "color": "#999999"
        }
    },
    "markPoint": {
        "label": {
            "color": "#ffffff"
        },
        "emphasis": {
            "label": {
                "color": "#ffffff"
            }
        }
    }
}

 浙公网安备 33010602011771号