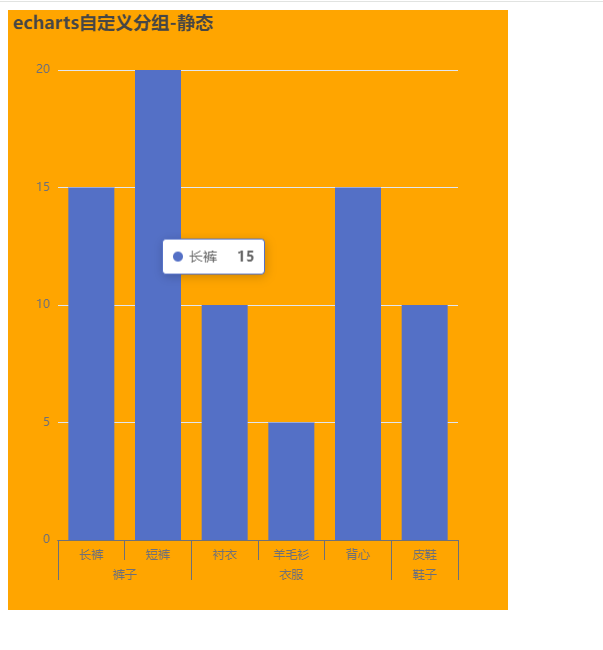
效果图#

<template>
  <div class="app">
    <div class="demo" ref="demoRef"></div>
  </div>
</template>

<script>
import * as echarts from 'echarts'
export default {
  data() {
    return {}
  },
  mounted() {
    this.initChart()
  },
  methods: {
    initChart() {
      var chart = echarts.init(this.$refs.demoRef)

      var xAxisData = ['长裤', '短裤', '衬衣', '羊毛衫', '背心', '皮鞋']
      //var xAxisGroupData =  [ "裤子", "裤子", "衣服", "衣服", "衣服" , "鞋子" ];
      var xAxisGroupData = ['{offset|}裤子', '', '', '衣服', '', '鞋子'] // 分组显示的标签(组内如果是偶数加上偏移{offset|},如果是计数放正中间)
      var seriesData = [15, 20, 10, 5, 15, 10]

      var groupSeparates = [true, false, true, false, false, true] // 分组分隔线

      // 指定图表的配置项和数据
      var option = {
        title: {
          text: 'echarts自定义分组-静态',
        },
        tooltip: {},
        xAxis: [
          {
            position: 'bottom',
            data: xAxisData,
            axisTick: {
              length: 20, // 刻度线的长度
            },
            axisLabel: {
              margin: 10, // 标签到轴线的距离
            },
          },
          {
            position: 'bottom',
            data: xAxisGroupData,
            axisTick: {
              length: 40,
              interval: function (index, value) {
                return groupSeparates[index] // 根据标识分组的刻度线
              },
            },
            axisLabel: {
              margin: 30,
              interval: 0, // 显示所有标签
              rich: {
                offset: {
                  width: 0,
                },
              },
            },
          },
        ],
        yAxis: {},
        series: [
          {
            type: 'bar',
            data: seriesData,
          },
        ],
      }

      chart.lastBandWidth = 0
      // 监听渲染事件,只要bandWidth发生变化,重新设置标签偏移的值
      chart.on('rendered', function () {
        var bandWidth =
          chart._chartsViews[0].renderTask.context.outputData._layout.bandWidth
        console.log('ddd=>', bandWidth, chart)
        if (chart.lastBandWidth != bandWidth) {
          chart.lastBandWidth = bandWidth
          // 延时执行否则echarts渲染异常
          setTimeout(() => {
            // 加上偏移后重新绘制
            var optionNew = { xAxis: [{}, {}] }
            // 增量更新偏移值
            optionNew.xAxis[1] = {
              axisLabel: { rich: { offset: { width: chart.lastBandWidth } } },
            }
            //console.info(optionNew);
            chart.setOption(optionNew)
          }, 0)
        }
      })

      // 绘制
      chart.setOption(option)
    },
  },
}
</script>

<style lang="less" scoped>
.demo {
  width: 500px;
  height: 600px;
  background-color: orange;
}
</style>
参考文档#
https://blog.csdn.net/chch87/article/details/123877652


【推荐】国内首个AI IDE,深度理解中文开发场景,立即下载体验Trae
【推荐】编程新体验,更懂你的AI,立即体验豆包MarsCode编程助手
【推荐】抖音旗下AI助手豆包,你的智能百科全书,全免费不限次数
【推荐】轻量又高性能的 SSH 工具 IShell:AI 加持,快人一步
· 被坑几百块钱后,我竟然真的恢复了删除的微信聊天记录!
· 没有Manus邀请码?试试免邀请码的MGX或者开源的OpenManus吧
· 【自荐】一款简洁、开源的在线白板工具 Drawnix
· 园子的第一款AI主题卫衣上架——"HELLO! HOW CAN I ASSIST YOU TODAY
· Docker 太简单,K8s 太复杂?w7panel 让容器管理更轻松!
2023-08-26 在vue中使用svg