使用joinjs绘制流程图(三)-Rect对象属性
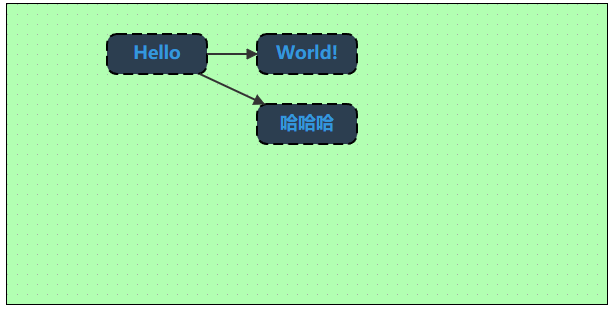
效果#
代码#
<template>
  <div class="app">
    <div ref="myholder" id="paper"></div>
  </div>
</template>

<script>
import * as joint from '@joint/core'
export default {
  data() {
    return {
      graph: null,
    }
  },
  mounted() {
    const namespace = joint.shapes
    var graph = new joint.dia.Graph({}, { cellNamespace: namespace })
    this.graph = graph

    var paper = new joint.dia.Paper({
      el: this.$refs.myholder,
      model: this.graph,
      width: 600,
      height: 300,
      cellViewNamespace: namespace,
      drawGrid: true,
      gridSize: 10,
      background: {
        color: 'rgba(0, 255, 0, 0.3)',
      },
    })

    const node1 = this.drawRect({ x: 100, y: 30 }, 'Hello')
    const node2 = this.drawRect({ x: 250, y: 30 }, 'World!')
    const node3 = this.drawRect({ x: 250, y: 100 }, '哈哈哈')
    this.drawLine(node1, node2)
    this.drawLine(node1, node3)
  },
  methods: {
    drawRect({ x, y }, text) {
      var rect = new joint.shapes.standard.Rectangle()
      rect.position(x, y)
      rect.resize(100, 40)
      rect.attr({
        body: {
          // 填充色
          fill: '#2c3e50',
          // 圆角x的半径
          rx: 10,
          ry: 10,
          // 边框宽度
          // strokeWidth: 0,
          // 虚线样式
          strokeDasharray: '10,5',
        },
        label: {
          text,
          // 字体样式
          fill: '#3498DB',
          fontSize: 18,
          fontWeight: 'bold',
          fontVariant: 'Microsoft YaHei',
        },
      })
      rect.addTo(this.graph)
      return rect
    },
    drawLine(node1, node2) {
      var link = new joint.shapes.standard.Link()
      link.source(node1)
      link.target(node2)
      link.addTo(this.graph)
    },
  },
}
</script>

<style lang="less" scoped>
#paper {
  border: 1px solid;
}
</style>
标签:
前端插件


【推荐】国内首个AI IDE,深度理解中文开发场景,立即下载体验Trae
【推荐】编程新体验,更懂你的AI,立即体验豆包MarsCode编程助手
【推荐】抖音旗下AI助手豆包,你的智能百科全书,全免费不限次数
【推荐】轻量又高性能的 SSH 工具 IShell:AI 加持,快人一步
· winform 绘制太阳,地球,月球 运作规律
· AI与.NET技术实操系列(五):向量存储与相似性搜索在 .NET 中的实现
· 超详细:普通电脑也行Windows部署deepseek R1训练数据并当服务器共享给他人
· 【硬核科普】Trae如何「偷看」你的代码?零基础破解AI编程运行原理
· 上周热点回顾(3.3-3.9)
2020-04-29 下载时,经常看见ASC、MD5、SHA1等,是干什么的呢?