
How to find what is in unmanaged memory in Dump by WinDBG
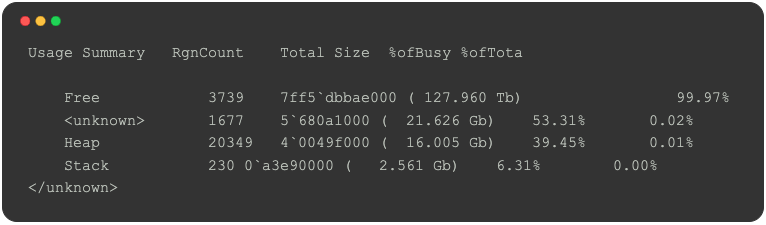
!address -summary
I results are something like this
How can I find what in in Heap? What are objects or what are types?
Is Managed Heap, and Heap is managed heap?
It is very hard to ask Questions Like this, so I added more info
Here is my C# Sample Code
class Program
{
    public static int[] arr;
    public static AllocateUnmanagedMemory cls;
    static void Main(string[] args)
    {
        const int GBSize = 1 * 1024 * 1024 * 1024/ sizeof(int);
        Console.WriteLine("Allocating");
        arr = new int[GBSize];
        cls = new AllocateUnmanagedMemory();
        cls.UnmanagedAllocation();
        Console.ReadLine();
    }
}
Here is Unmanaged Allocation Code:
using System; using System.Runtime.InteropServices;
public class AllocateUnmanagedMemory {
static IntPtr pointer;
public void UnmanagedAllocation()
{
    pointer = Marshal.AllocHGlobal(1024 * 1024 * 1024 );
}
}
And results from WinDbg Preview in Windows 10
I should be able find somewhat that code for Unmanaged Allocation, allocated 1Gb memory.
The basics
The command !address operates on a very low level, barely above the operating system. However, it will recognize a little bit of the memory manager that comes with Windows: the Windows Heap Manager.
So, what you see as Heap that is memory which was allocated through the Windows Heap manager. On your level of understanding, that's the native heap.
Any other heap managers will implement their own memory management. Basically they all work similar: they get large blocks of memory from VirtualAlloc() and then try to do a better magement of the small blocks within that large block. Since WinDbg doesn't know any of these memory managers, that memory is declared as <unknown>. It includes, but is not limited to the managed heap of .NET. For other potential uses, see this answer.
Free is memory that can potentially be claimed from the operating system. This may include swap space, not only physical RAM.
Stack, well that's obvious I think.
The heaps
How can I find what in in Heap? What are objects or what are types?
The answer to this question heavily depends on which heap you're talking about.
The Windows Heap Manager ("native heap") just manages memory and does not manage types. It's not possible on that level to distinguish two objects of the same size but different type. If you have a memory leak, you can only give a statement like "I have a leak of n bytes". To find our more about the native heap, start with !heap -s and look up the other !heap commands.
The .NET managed heap retains a type system. To analyze the managed heap, you need an extension for WinDbg called sos. Usually you load it by .loadby sos clr. It has a command !dumpheap -stat which may give you a first impression of its capabilities. (Run the command twice if you get an error message)
This should give you enough hints to do further research and find more details in your crash dump.
Strange?
You seem to have 230 stacks with a total of 2.5 GB of memory. That is about 11 MB of memory per stack. Usually that's limited to 1 MB.
Your updated example code
I compiled the following program
using System;
using System.Runtime.InteropServices;
namespace SO55043889
{
    class Program
    {
        public static int[] arr;
        static IntPtr pointer;
        static void Main()
        {
            const int GBSize = 1 * 1024 * 1024 * 1024/ sizeof(int);
            Console.WriteLine("Allocating");
            arr = new int[GBSize];
            pointer = Marshal.AllocHGlobal(1024 * 1024 * 1024 );
            Console.ReadLine();
            Console.WriteLine(pointer.ToInt32() + arr[0]);
        }
    }
}
I ran the application and I attached to the process with WinDbg. I took a dump using
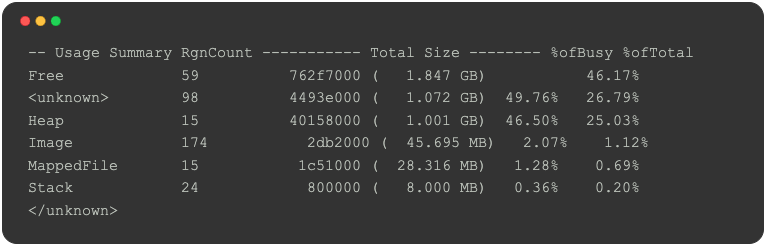
and now we can analyze it like this:
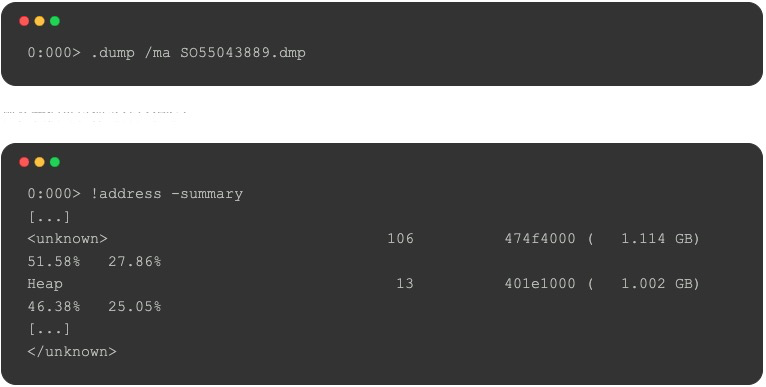
So we see 1 GB of (potentially) .NET memory and 1 GB of native memory.
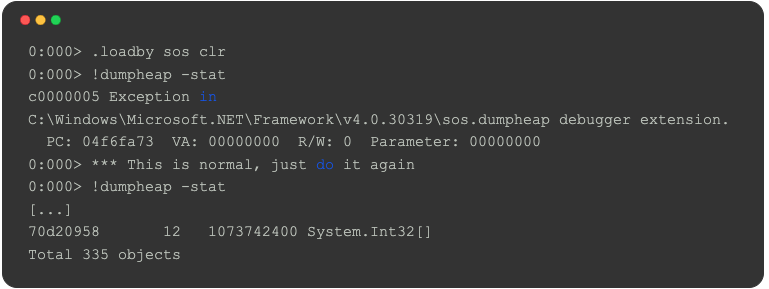
There are 12 int[] on the .NET side, taking a total of ~1 GB from the managed heap. Looking at the details, we see that there's only one big array and some smaller ones:
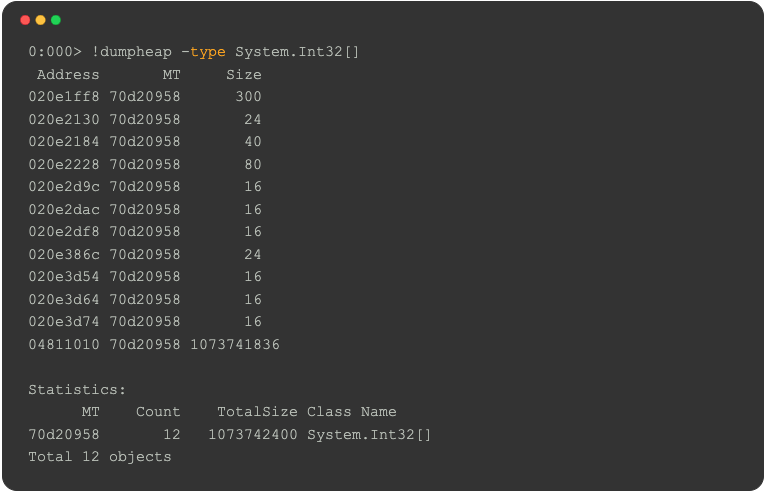
That's not what you wanted know. I just showed you how easy it is on the .NET side.
Now the native side:
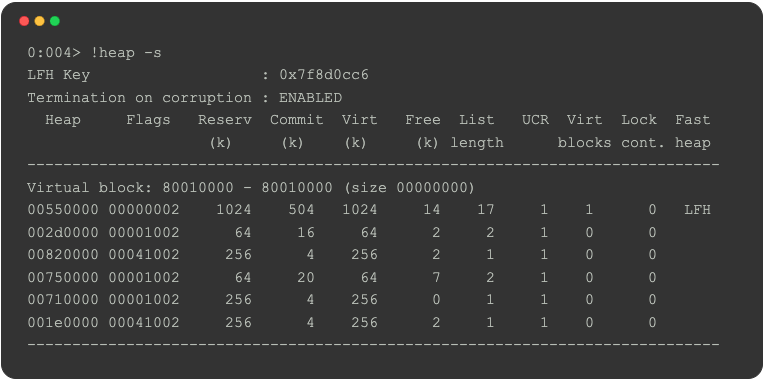
We can't see the 1 GB here. And there's a reason for that.
As explained before, heap managers are good at dividing large blocks from VirtualAlloc() (which are 64kB) into smaller pieces. They do that because it would be a big waste to allocate 64kB just for a 4 byte int. However, there's no need to create heap management stucture for large blocks. For an allocation of 2^30+1 byte, the OS would return 2^30+64kB, which means the overhead is just 0.006%.
That's why you will find allocations >512kB not inside the usual heap management structures but as a Virtual block, which means that the Windows Heap Manager has simply forwarded the request to VirtualAlloc().
There's another issue here: the output for the size is broken. It says

which obviously is not true. Let's look at it ourselves:
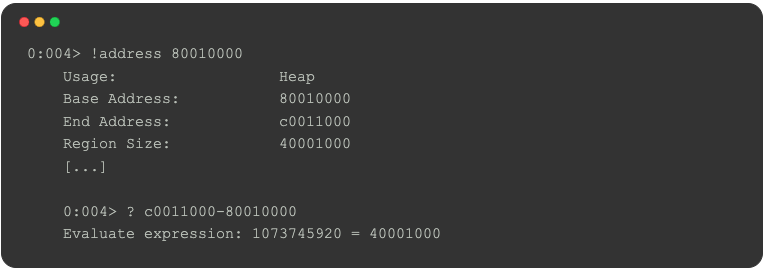
What we see here is that End Adress - Base Address equals the Region Size and the size is 1 GB.
At this point, it's worth noting that the user mode stack trace database is useless. It only applies to items on the heap, but not VirtualAlloc(). You'll not figure out who allocated the 1 GB block.
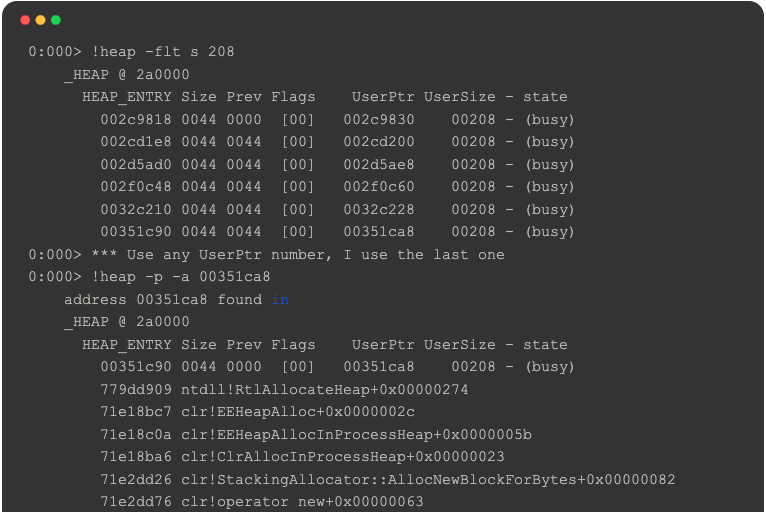
And I forgot to enable the user mode stack trace database anyway. Let's do that and cross check
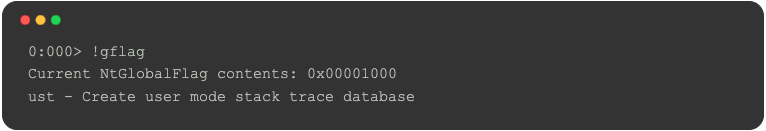
And now, there should be stack traces for smaller pieces of memory. In this example, I use an arbitrary block of size 0x208:
Just one more note: if you modify the program to have smaller blocks of memory, e.g.
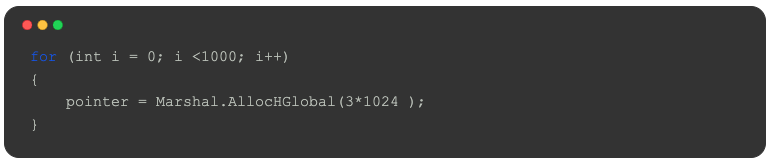
You will see the allocation in the heap:
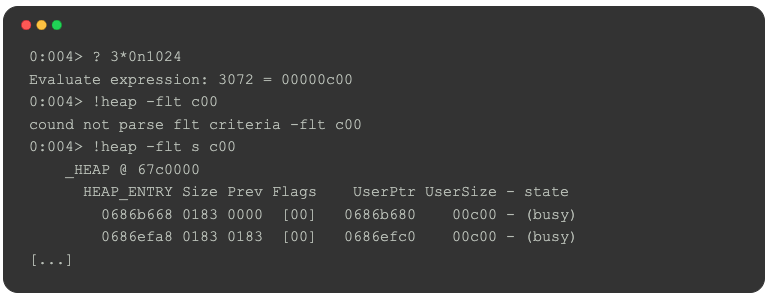
And you will see stack traces
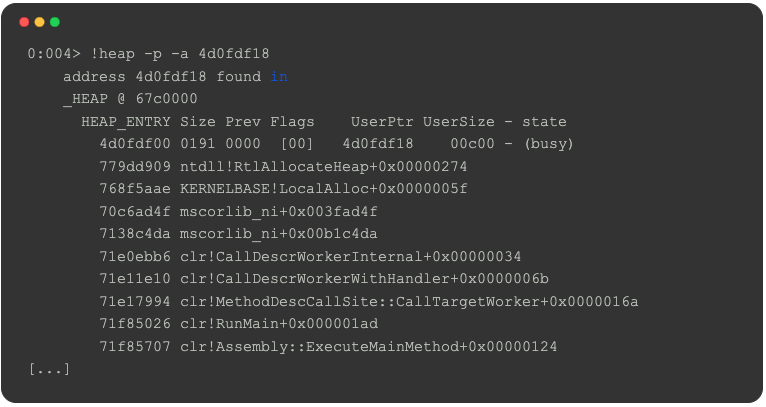
But you won't see the managed method calls.
That's because the USt database was built for native only. It's the same reason you have different stacks in .NET using k or !dumpstack.
南来地,北往的,上班的,下岗的,走过路过不要错过!
======================个性签名=====================
之前认为Apple 的iOS 设计的要比 Android 稳定,我错了吗?
下载的许多客户端程序/游戏程序,经常会Crash,是程序写的不好(内存泄漏?刚启动也会吗?)还是iOS本身的不稳定!!!
如果在Android手机中可以简单联接到ddms,就可以查看系统log,很容易看到程序为什么出错,在iPhone中如何得知呢?试试Organizer吧,分析一下Device logs,也许有用.

