
How does the GC work and what are the sizes of the different generations?
During our ASP.NET debugging chat there were many questions around the GC and the different generations. In this post I will try to explain the basics of how the GC works and what you should think about when developing .net applications in relation to the GC.
First off, there is already a lot written about the .net Garbage Collector. One of the best resources regarding how the GC works and how to program efficiently for the GC is Maoni’s blog. She hasn’t written anything since May 2007 but all the posts on her blog are still very relevant since the GC hasn’t really changed enough that it makes a difference as far as .net developers should be concerned.
Maoni had a presentation at the 2005 PDC about the GC and unfortunately her link to the presentation points to an invalid location so if you are interested in looking at it I have uploaded it here. Most of what I will discuss in this article is a mixture of her presentation along with things I have learned along the way, and some of the pictures in the post are taken straight from her presentation.
Table of ContentsPermalink
- Table of Contents
- What are segments and heaps? How much is allocated for the GC?
- What are generations and why do we use a generational GC?
- When and how does a collection occur?
- What are roots? What keeps an object alive?
- What is the Large Object Heap? And why does it exist?
- Which GC Flavor fits my application best?
- What is the cost of a garbage collection? How can I keep this cost at a minimum?
- Additional Resources
What are segments and heaps? How much is allocated for the GC?Permalink
When you first start up a .net application the GC will allocate memory to store your .net objects.
How much it will allocate is depends on what framework version you use (including service packs or hotfixes), if you are running on x64 or x86 and what GC flavor the application is using (workstation or server)
Here is an example of how the heaps and segments look for 2.0.50727.1433 (2.0 SP1), on a dual proc running ASP.NET (the server flavor of the GC).
We have two heaps (one per logical processor since we are running the server GC) and each heap initially has one “small object” segment and one large object segment.
The initial allocation size here is 192 MB because the GC reserved 64 MB for each small object segment and 32 MB for each large object segment.
0:000> !eeheap -gc
Number of GC Heaps: 2
------------------------------
Heap 0 (001c3a88)
generation 0 starts at 0x0310d288
generation 1 starts at 0x030ee154
generation 2 starts at 0x03030038
ephemeral segment allocation context: none
segment   begin    allocated size                reserved
001c92f0  7a733370 7a754b98  0x00021828(137,256) 00004000
001c5428  790d8620 790f7d8c  0x0001f76c(128,876) 00004000
03030000 03030038 03115294 0x000e525c(938,588) 03d3f000
Large object heap starts at 0x0b030038
segment   begin     allocated  size                    reserved
0b030000 0b030038 0b4d5aa8 0x004a5a70(4,872,816) 01af8000
Heap Size 0x5cbc60(6,077,536)
------------------------------
Heap 1 (001c4a48)
generation 0 starts at 0x0712614c
generation 1 starts at 0x071014ac
generation 2 starts at 0x07030038
ephemeral segment allocation context: none
segment   begin     allocated  size                    reserved
07030000 07030038 07134158 0x00104120(1,065,248) 03d2f000
Large object heap starts at 0x0d030038
segment    begin    allocated  size                  reserved
0d030000 0d030038 0d0f3588 0x000c3550(800,080) 01f3c000
Heap Size 0x1c7670(1,865,328)
------------------------------
GC Heap Size 0x7932d0(7,942,864)
If you want to know how much the GC has reserved and committed for your particular version/flavor of the GC you can look at the performance counters # Total Committed Bytes and # Total Reserved Bytes under .net CLR memory.
You can also use !address to calculate your segment size from a dump. For example, this small object heap segment starting at 03030000.
03030000 03030038 03115294 0x000e525c(938,588) 03d3f000
has 0x002c1000 bytes committed and an additional 0x03d3f000 bytes reserved, so the small object heap segment size for this version and GC flavor is 0x002c1000+0x03d3f000 bytes = 64 MB
0:000> !address 03030000
03030000 : 03030000 - 002c1000
Type     00020000 MEM_PRIVATE
Protect  00000004 PAGE_READWRITE
State   00001000 MEM_COMMIT
Usage    RegionUsageIsVAD

0:000> !address 03030000+002c1000
03030000 : 032f1000 - 03d3f000
Type     00020000 MEM_PRIVATE
State   00002000 MEM_RESERVE
Usage    RegionUsageIsVAD
Since this is a number that is subject to change in any hotfix or service pack you shouldn’t rely on it, but if you are wondering how much you are allocating, that is the answer.
For example 2.0 SP1 (2.0.50727.1433) has a segment size of 512 MB for the small object segments and 128 MB for the large object segments so the initial allocation size is a lot bigger on 64 bit which causes generation 2 collections to occur much more seldom.
| Server GC | Workstation GC | Workstation GC+Concurrent | |
|---|---|---|---|
| # of heaps | 1 per logical processor | 1 | 1 |
Once a segment is full a new segment is created within the same heap, so a heap can have many small object heap segments and many large object heap segments but the number of .net heaps will not change during the life of the process. The memory within the segments is committed and de-committed as needed and the segments are deleted when they are no longer needed.
The two small segments at the beginning of heap 1 are used to store string constants and you can simply ignore them as they won’t really affect your application in any real sense.
What are generations and why do we use a generational GC?Permalink
In a generational GC objects are created in Gen 0 and if they are still alive when a collection happens they get promoted to Gen 1. If they are still alive when a Gen 1 collection happens they are promoted to Gen 2 etc. until they finally end up in their final resting place in the highest generation.
The idea behind a generational GC is that most objects are very temporary, like locals, parameters etc. i.e. they go out of scope while in generation 1. If we can keep collecting just these objects without having to go through all the memory we will save a lot of time and CPU power when cleaning up the objects.
The longer an object has been alive, the more likely it is that the object will be around for a very long time. Think about it, most objects that survive a couple of collections are objects that are stored in cache, session scope or in other long term storage like static variables. If we know that this is the case then we don’t have to bother constantly searching through them all.
In the .net GC there are 3 generations (0, 1, and 2) and then there are the large objects (objects over 85000) that end up in a separate segment. The LOH objects are different in the sense that even if they survive a collection they are not promoted since they exist outside of Gen 0, 1, and 2.
There are a few other benefits to a generational garbage collector because of how allocations are done.
If we look at our first heap:
Heap 0 (001c3a88)
generation 0 starts at 0x0310d288
generation 1 starts at 0x030ee154
generation 2 starts at 0x03030038
ephemeral segment allocation context: none
segment begin allocated size reserved
…
03030000 03030038 03115294 0x000e525c(938,588) 03d3f000
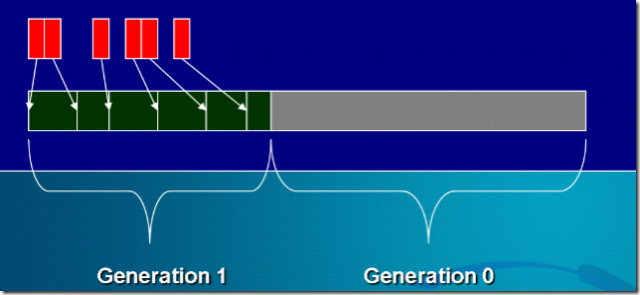
The small object segment would look like this, where the green part is Gen 2, blue is Gen 1 and Orange is Gen 0

When a new object is allocated it will be allocated right after the last object on the heap (in gen 0) at address 0x03115294 and it will continue like that, growing until Gen 0 has reached its budget at which point a garbage collection will occur.
Since objects are allocated sequentially in the segment the cost of allocation is extremely small. It consists of taking a cheap lock (on single proc), moving a pointer forward, clearing the memory for a new object and register the new object with the finalize queue if it has a finalizer/destructor. The fact that they are allocated sequentially also gives a few other benefits such as locality of time and reference which means that objects that are allocated in the same method at the same time are stored close together. Since they are allocated at the same time/place they are likely to be used together and accessing them will be very quick.
Generation 1 and 0 live in something called the ephemeral segment (the first small object segment in each heap) and the size of Gen 1 and Gen 0 can never exceed the size of a segment. If a new segment is created that will become the new ephemeral segment. Gen 2 on the other hand can grow indefinitely (or until you run out of memory) so if you have high memory consumption a large amount of your objects will live in Gen 2.
The budgets for generation 1 and 0 vary over time based on the allocation pattern of the process and how much is actually collected during each collection. You can see what the current budget for Gen 0 is by looking at the .net CLR memory/Gen 0 heap size.
When and how does a collection occur?Permalink
A collection occurs
- When you allocate a new object and the generation 0 budget is reached, i.e. if the new object would cause it to go over budget.
- When someone calls GC.Collect (Induced GC)
- Based on memory pressure
Contrary to popular belief collections don’t happen at certain time intervals etc. so this means that if your application is not allocating any memory and is not calling GC.Collect, no collections will occur. It is also important to understand that collections of the higher generations will only occur once their budgets are reached, and in the case of 64-bit processes gen 2 collections occur very seldom which means that a lot of memory may be sitting around even though it is not in use, just because it made its way into gen 2.
If you have a process (64 or 32 bit) that does not use a lot of .net objects, but does use a lot of native resources like threads, connections etc. you may end up in a situation, if you are not properly cleaning up the threads, connections etc. where you run out of native resources and handles because the objects have not been collected. Therefore it is absolutely crucial that you do dispose/close all objects that have native resources right after you are finished using them.
A garbage collection simplified goes through the following sequence
- Suspend all threads that are making .net calls (i.e. could be allocating objects or modifying the objects on the heap). Threads making native calls are suspended on their return to managed code.
- Determine which objects in the current generation can be garbage collected. This is done by asking the JIT, the EE Stack Walker, the Handle table and the finalize queue which objects are still accessible/in use. See maonis post “I am a happy janitor” for more info on this.
- Delete all marked objects or add the empty spaces to a free list if the heap is not compacted.
- Compact/Move the leftover objects to the backend of the heap (this is the most expensive part)
- Resume all threads
Here is a collection, step by step (with pictures from Maonis presentation)
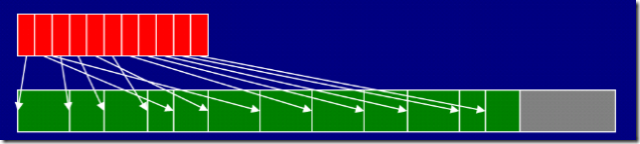
Allocate new objects at the end of the heap in Gen 0
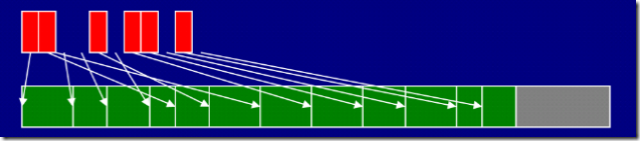
Determine which objects are still accessible
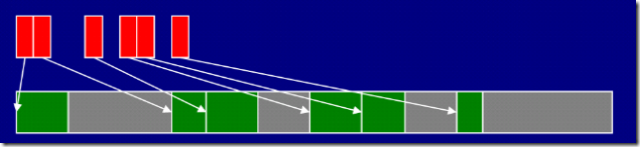
Sweep the garbage and add the free blocks to the free-list to store new objects there if non-compacting
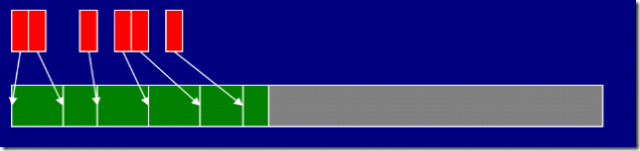
Compact the heap
Move the start of generation 0 to the end of the objects that survived. The survivors are now in generation 1
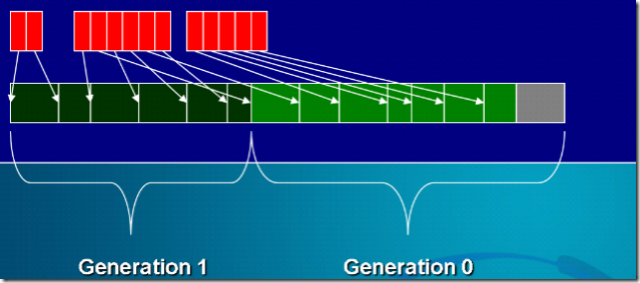
New objects are allocated in generation 0
A gen 1 collection can’t occur without a Gen 0 collection so any time a Gen 1 collection occurs it will be a Gen 1 + Gen 0, and same of course for Gen 2.
What are roots? What keeps an object alive?Permalink
If your object is rooted, that means that an object (a root) has a reference (directly or indirectly) to your object, and that that root object is either on a stack as a parameter or local, or it is a static variable, or it is on the finalizer queue, meaning that it needs to be finalized before it can be released. See this post for a discussion of different types of roots and what they mean.
An object is also considered alive if it is referenced by an object in an older generation, until that older object is collected of course.
What is the Large Object Heap? And why does it exist?Permalink
The large object heap is a special segment (or multiple segments) in a heap, specifically meant for objects over 85000 bytes. As I have mentioned many times before in my posts this 85000 refers to the size of the object itself, not the size of the object and all its children.
The example I always use is a large dataset. The dataset itself is merely a collection of a few links to different arrays, so the dataset object will never grow independently of the number of rows or columns it has, it will consistently stay at 80 bytes or 120 bytes etc. (different in different framework versions). In other words the dataset will never make it to the large object heap.
The objects that will be stored on the large object heap are usually strings and arrays of different kinds since a string is stored in one contiguous chunk rather than a linked list of the different characters. Same thing with an array, but again, here it is important to understand that it is just the size/length of the array that determines if it is a large object or not, not the total size of the objects that it references.
When you create a large object, for example a large string, it immediately goes on the large object heap segment so it is never even allocated in gen 0. As mentioned before the large object heap segment is not generational, if an object in the LOH is alive during a collection, it simply stays on the LOH.
The reasoning behind having a special heap for large objects is that it is very expensive to move them around, and particularly for arrays for example, it is very expensive to update all the references etc. Therefore the LOH is not compacted, instead any space that is left between objects when a garbage collections occur are put on a free-list so that if a new object is allocated it can be allocated in that free space. If multiple collections occur causing two or more free spaces after each other these are coalesced into one larger free space.
The large object heap is collected when a gen 2 collection occurs.
Which GC Flavor fits my application best?Permalink
At present there are three different versions / flavors of the GC, each optimized for different types of applications.
Server GCPermalink
The server GC is optimized for high throughput and high scalability in server applications where there is a consistent load and requests are allocating and de-allocating memory at a high rate. The server GC uses one heap and one GC thread per processor and tries to balance the heaps as much as possible. At the time of a garbage collection, the GC threads work on their respective threads and rendez-vous at certain points. Since they all work on their own heaps, minimal locking etc. is needed which makes it very efficient in this type of situation.
The Server GC is only available on multi processor machines. If you try to set the server GC on a uni proc machine you will instead get the workstation version with non concurrent GC.
This flavor is what ASP.NET uses by default on multi processor machines, as well as a number of other server applications. If you want to use the server GC in a windows service you can do so by setting
<configuration>
 <runtime>
   <gcServer enabled="true" />
 </runtime>
</configuration>
In the applications config file
Workstation GC – ConcurrentPermalink
This is the default setting for win forms applications and windows services.
The Workstation GC is optimized for interactive applications that can’t allow for the application to be paused even for relatively short periods since pausing the threads would cause flicker in the user interface or make the application feel non responsive to button clicks etc.
This is done by trading CPU and memory usage for shorter pause time when doing generation 2 collections.
Workstation GC – Non ConcurrentPermalink
The non-concurrent Workstation GC mimics the server GC except for that collections are done on the thread that triggers the GC. This mode is recommended for server type applications running on a single proc box.
You can turn concurrency off in the application config file
<configuration>
 <runtime>
   <gcConcurrent enabled="false" />
 </runtime>
</configuration>
| Concurrent WS | Non-Concurrent WS | Server GC | |
|---|---|---|---|
| Design Goal | Balance throughput and responsiveness for client apps with UI | Maximize throughput on single-proc machines | Maximize throughput on MP machines for server apps that create multiple threads to handle the same types of requests |
| Number of heaps | 1 | 1 | 1 per processor (HT aware) |
| GC threads | The thread which performs the allocation that triggers the GC | The thread which performs the allocation that triggers the GC | 1 dedicated GC thread per processor |
| EE Suspension | EE is suspended much shorter but several times during a GC | EE is suspended during a GC | EE is suspended during a GC |
| Config setting | <gcConcurrent enabled="true"> |
<gcConcurrent enabled="false"> |
<gcServer enabled="true"> |
| On a single processor machine | WS GC + non-concurrent |
What is the cost of a garbage collection? How can I keep this cost at a minimum?Permalink
You can measure the GC cost for your application with a few different counters. Remember that all of these counters are updated at the end of a collection which means that if you use averages they may not be valid after a long time of inactivity.
- .NET CLR Memory\% time in GC - This counter measures the amount of CPU time you spend in GC and it is calculated as (CPU time for GC/CPU time since last GC)
- .NET CLR Memory# Induced GC – This is the number of garbage collections that have occurred as a result of someone calling GC.Collect(). Ideally this should be 0 since inducing full collections means that you spend more time in the GC, and also because the GC continuously adapts itself to the allocation patterns in the application, and performing manual GCs skews this optimization.
- .NET CLR Memory# Gen X collections – This counter displays the amount of collections that have been performed for a given generation. Since the cost of gen 2 collections is high compared to Gen 1 and Gen 0 you want to have as few Gen 2 collections per Gen 1 and Gen 0 collections as possible. A ratio of 1:10:100 is pretty good.
The most common causes for high CPU in GC or a high number of Gen 2 collections compared to 1 and 0 is high allocation of large objects and letting objects survive multiple generations because of improper use of finalizers or because finalizable objects are not disposed of correctly in the application.
Additional ResourcesPermalink
- Maonis blog
- Generational GC - A post-it analogy
- .NET Hang Case Study: The GC-Loader Lock Deadlock (a story of mixed mode dlls)
- ASP.NET Case Study: High CPU in GC - Large objects and high allocation rates
- ASP.NET Case Study: Bad perf, high memory usage and high CPU in GC - Death By ViewState
- .Net memory leak: Unblock my finalizer
- .NET Memory: My object is not rooted, why wasn’t it garbage collected?
- Who is this OutOfMemory guy and why does he make my process crash when I have plenty of memory left?
- .NET Garbage Collector PopQuiz - Followup
- Maonis presentation at PDC 2005
GC工作原理
目录:
什么是段(segments)和堆(heaps),为GC分配了多少?
什么是代(generations),我们为什么使用带有代的GC?
什么时间发生收集,如何发生的?
什么是根(root),是什么保证一个对象存活?
什么是大对象堆(large object heap),为什么存在?
哪种加了味(模式)的GC适合我的应用程序?
垃圾收集(garbage collection ,GC)的代价是什么,如何保证代价最小?
其他资源
什么是段(segments)和堆(heaps),为GC分配了多少
当第一次运行一个.net 应用程序的时候,GC会分配内存来存储你的.net对象。
分配多少是有你的 dotnet framework的版本(包括service packs 或者 hotfixes)决定的。如果你运行在x64 或x86上,GC给你的应用程序加了什么味(模式)呢? Workstation 或者 server。
这里有一个例子描述了在2.0.50727.1433 (2.0 SP1)版本上,堆(heaps)和段(segments)的一些特性, 它是一个运行在双核上的asp.net(即是server味的GC)应用程序。
这里有两个堆(因为是运行在双核上的server GC),而且每个堆初始都有一个“小对象”段和一个大对象段。
这个初始化的大小是192M,因为GC申请预保留64M给小对象段,32M给大对象段。
0:000> !eeheap -gc
Number of GC Heaps: 2
------------------------------
Heap 0 (001c3a88)
generation 0 starts at 0x0310d288
generation 1 starts at 0x030ee154
generation 2 starts at 0x03030038
ephemeral segment allocation context: none
segment begin allocated size reserved
001c92f0 7a733370 7a754b98 0x00021828(137,256) 00004000
001c5428 790d8620 790f7d8c 0x0001f76c(128,876) 00004000
03030000 03030038 03115294 0x000e525c(938,588) 03d3f000
Large object heap starts at 0x0b030038
segment begin allocated size reserved
0b030000 0b030038 0b4d5aa8 0x004a5a70(4,872,816) 01af8000
Heap Size 0x5cbc60(6,077,536)
------------------------------
Heap 1 (001c4a48)
generation 0 starts at 0x0712614c
generation 1 starts at 0x071014ac
generation 2 starts at 0x07030038
ephemeral segment allocation context: none
segment begin allocated size reserved
07030000 07030038 07134158 0x00104120(1,065,248) 03d2f000
Large object heap starts at 0x0d030038
segment begin allocated size reserved
0d030000 0d030038 0d0f3588 0x000c3550(800,080) 01f3c000
Heap Size 0x1c7670(1,865,328)
------------------------------
GC Heap Size 0x7932d0(7,942,864)
如果你想要知道针对你的应用的GC版本和模式,GC已经申请预保留和已保留的内存,你可以查看性能计数器 .net CLR memory /# Total Committed Bytes 和 .net CLR memory/ # Total Reserved Bytes。
你也可以使用 !address 从你dump文件中来计算你的段的大小,例如,小对象堆的段开始于03030000….
03030000 03030038 03115294 0x000e525c(938,588) 03d3f000
有 0x002c1000字节是已申请的,还有额外的0x03d3f000字节预申请。所以针对这个模式和版本的GC的小对象大小是0x002c1000+0x03d3f000 bytes = 64 MB。
0:000> !address 03030000
03030000 : 03030000 - 002c1000
Type 00020000 MEM_PRIVATE
Protect 00000004 PAGE_READWRITE
State 00001000 MEM_COMMIT
Usage RegionUsageIsVAD
0:000> !address 03030000+002c1000
03030000 : 032f1000 - 03d3f000
Type 00020000 MEM_PRIVATE
State 00002000 MEM_RESERVE
Usage RegionUsageIsVAD
因为这些数字是随着不同的补丁改变的,所以你不能依赖这些数字,但当你想知道分配了多少,这就是答案。
例如针对64位的2.0.50727.1433 (2.0 SP1)版本,有512M的小对象段和128M的大对象段的初始化大小,所以在第二代上的收集将会发生的更少。
|
|
Server GC |
Workstation GC |
Workstation GC+Concurrent |
|
# of heaps |
1 per logical processor |
1 |
1 |
上表显示的是heap个数与GC模式的关系。
段是可以在堆上创建的,所以一个堆会有很多的小对象段和很多的大对象段,但是.net 堆的数量在一个进程的生命周期中是不会改变的。段里的内存可以随着需要申请已保留和取消。当段不再需要的时候,段也可以删除。
在开始的那个堆1上的两个小段是用来存储字符串常量的。你可以忽略他们,因为它们不会对你程序造成什么实际的影响。
什么是代(generations),我们为什么使用带有代的GC
在GC的代中的对象是在Gen 0 中被创建的。当收集发生的时候,它们还需要存活的话,它们就会升迁到Gen 1中去,当 Gen 1 的收集发生的时候,他们还需要存活,那就会升迁到Gen 2 中去,类似的,直到他们休息的最高的代中去,当可以结束他们生命周期的时候才结束。
GC带的思想是大部分的对象都是临时的,比如局部变量,参数等,当它们超出一定的范围时就失效了。当我们需要收集这些对象的时候,我们就不需要搜索整个内存,我们可以节省很多的时间和cpu能量。
一个对象存在的时间越长,表明更有可能还会使用更长的时间。可以这样想,那些在几轮收集之后还存在的对象最有可能是那些存在cache、session或者更长的存储周期的比如static的对象,如果我们知道这个道理,那我们就不会不断的抱怨到处的去搜寻他们了。
在.net 的GC中有3个代(0,1和2)和排在段末尾的大对象(大于85000字节)。LOH对象在这里面是不同的,即时他们在收集时还是存活,但他们不会升迁,因为他们在Gen 0,1,2 之外。
当然,垃圾收集器在一个分配完成的过程里还会有其他的一些行为动作。
如果我们看我们第一个堆:
Heap 0 (001c3a88)
generation 0 starts at 0x0310d288
generation 1 starts at 0x030ee154
generation 2 starts at 0x03030038
ephemeral segment allocation context: none
segment begin allocated size reserved
…
03030000 03030038 03115294 0x000e525c(938,588) 03d3f000
小对象段看起来如下面:绿色表示Gen 2,蓝色表示Gen 1,桔色表示Gen 0。

当一个新对象被分配内存,它会放在堆的最后面(Gen 0),地址在0x03115294,其他的对象也是类似的,Gen 0 的大小就会增长,达到他的边界,在这一点上垃圾收集就会发生。
因为对象的分配是按顺序的,所以这个分配的消耗就会非常的小,它只需要把指针向前移动,清除一些对象,如果对象含有finalizer/destructor,就把它加入finalize队列。按顺序的分配也包含其他一些好处,比如节省时间和空间,意味着在同一个方法里面同时分配的对象被紧紧的放在一起,因为他们被同时同地的分配,也会被同时的使用,访问他们将是非常快的。
Gen 0 和Gen 1被称作生命短暂的段(每个堆上的第一个小对象段),Gen 0 和 Gen 1 的大小都不会超过段的大小。如果一个新的段被创建,它会成为一个新的生命短暂的段。Gen 2 是可以独立增长的段,除非你已经 out of memory,因此如果你有很高内存的问题,你的大部分对象都会存在在Gen 2中。
你可以通过查看性能计数器.net CLR memory/Gen 0 heap size 来得知 Gen 0 的预算大小。
什么时间发生收集,如何发生的?
在以下情况下收集发生:
l 当你分配新的对象,Gen 0 的预算大小已经达到。例如一个新对象的分配会导致Gen 0 的大小超过预算。
l 主动调用 GC.Collect()
l 有内存压力的时候
针对一般情况下人们相信存在的收集并不会发生,只有且仅当上面条件下才会发生收集。还有一点也是很重要的,更高代的收集发生于仅当他们的预算被触及之时。在64位的进程中,Gen 2 的收集发生的很少,那意味着有很多的内存要被保持着,即时那些内存没有使用,因为那些收集规则约束着它。
如果你有一个进程(64或32位),它没有使用很多的.net对象,但是使用了很多的原生资源比如说线程、数据库连接等,你必须适时的去释放掉,如果你不释放,那哪些对象不会被回收。因此,当你不再使用他们的时候,必须执行dispose/close来结束释放资源。
一次垃圾收集简单的说,是按照下面的流程来走的:
1) 挂起那些正在执行.net 调用的线程(比如分配一个对象或修改堆上的对象),执行原生调用的线程在他们返回到托管代码的时候挂起。
2) 决定哪些对象在当前代中是可以被垃圾收集的。通过询问JIT、EE stack walker、handle table和finalize queue来完成哪些对象还在使用中。
3) 删除所有标记删除的对象或在堆还没有合并的时候,添加一个空白到自由列表中(free list)
4) 合并移动残留下来的对象到堆的后端(代价最为昂贵)
5) 重新启动所有线程
下面是图示:(红色代表根,引用着对象)

在堆的末尾,Gen 0 处分配新的对象。

决定哪些对象仍然是可以访问的

扫除垃圾,添加空白到列表中,来存储对象,在未合并之前

合并堆

把Gen 0 的起始位置移动到对象的末尾,那些对象现在在Gen 1中了。

新对象分配在Gen 0 中
一个Gen 1 的收集一定是发生在Gen 0 之后的,所以任何一个Gen 1的回收都是Gen 1+Gen 0,同样的,Gen 2 也是类似的这样。
什么是根(root),是什么保证一个对象存活?
如果一个对象被根化,那就是意味着一个对象(根)直接或间接地引用着这个对象。那个根的对象可以是在栈上的参数或局部变量或是一个静态变量或者它在finalizer 队列中。
一个对象如果被一个更老的代中的对象(在被回收之前)引用也被认为是存活的。
什么是大对象堆(large object heap),为什么存在?
大对象堆是一个或多个很特殊的段,那里面的对象都是大于85000字节,这个大小指的是这个对象本身的结构行大小,并不包含这个对象的大小和它的子对象的大小。
我常拿来举例子的是一个很大的dataset,dataset本身仅仅是一些链接到不同数组的集合,所以dataset本身不会随着它所含有的行或列的增长而独立的增长。它会保持在80字节或120字节左右(版本不同,大小有些不同)。换句话说 dataset永远不会把自己放到LOH中去。
那些会被放在LOH中通常都是字符串和数组,因为一个字符串是存储在一个临近的一个大块内存,而不是链接到不同字符的链表。数组,必须明白,这里重要的是决定数组是否放在LOH中的是它的size/length,而不是它里面所引用的对象的总的大小。
当你创建一个字符串,例如一个很长的字符串,它会立刻被放到LOH中,而不是Gen 0 中,LOH不是代的,所以在一次收集中如果一个对象存活,那它就还是在LOH中。
为什么要有这么个特殊的堆存在的原因是在于,移动一个大对象的代价是很高的,特别是对数组而言,更新数组里所有的引用的代价很高。所以LOH不会合并,所以在垃圾收集之后,对象间的空白直接放到了自由列表中,一个新对象就直接放到那个空白中。如果多次收集之后,导致空白前后相互挨着,那它们就合并成为一个更大的空白空间。
LOH的收集发生在Gen 2收集的时候。
哪种加了味(模式)的GC适合我的应用程序?
到目前为止,一共有三种模式的GC,分别对应优化不同类型的应用程序。
Server GC
这种类型的GC是针对服务器端高吞吐量和高扩展性进行优化的,那情况是一种长时间的加载和请求不停地分配和重新分配,并维持在较高水准的情况。
这种server GC 使用每个处理器一个堆、一个GC线程,并尽量的保持堆之间的平衡。在垃圾收集的时候,GC线程工作在各自的线程中,这样就最小化了锁资源,就保证了在这种应用条件下最有效的工作。
这种类型的GC只有在多处理器的机器上可见,如果你在单处理器上的设置这种模式,那你将得到实际运行的模式是非并发的workstation版本(Non Concurrent)。现在的双核也是这种模式,intel的超线程技术实现的cpu并不是真实的多cpu,因此它不会使用这种模式。
Asp.net 在多cpu的机器上默认使用这种模式,如果你想使用server GC模式,你可以在应用程序级别上做如下设置:
<configuration>
<runtime>
<gcServer enabled="true" />
</runtime>
</configuration>
Workstation GC – Concurrent
这种被用来作为winform应用程序和windows services 服务程序的默认设置。
这种模式是对交互的应用程序,这种程序要求应用程序不能暂停,即时一个相对很短暂的时间也是不行的。因为暂停进程会让用户界面闪烁或者当点击按钮的时候感觉应用程序没有响应。
这种实现方式是当进行Gen 2 收集的时候,将cpu和内存的使用量作为更短的停顿时间。
Workstation GC – Non Concurrent
这种模式是模仿Server GC,只是收集是发生在引起GC的进程上,这种模式推荐为那种运行在单个cpu上的服务类型的应用程序。可以修改应用程序级上的配置来把 concurrency 关闭。
<configuration>
<runtime>
<gcConcurrent enabled="false" />
</runtime>
</configuration>
|
Concurrent WS |
Non-Concurrent WS |
Server GC |
|
|
Design Goal |
Balance throughput and responsiveness for client apps with UI |
Maximize throughput on single-proc machines |
Maximize throughput on MP machines for server apps that create multiple threads to handle the same types of requests |
|
Number of heaps |
1 |
1 |
1 per processor (HT aware) |
|
GC threads |
The thread which performs the allocation that triggers the GC |
The thread which performs the allocation that triggers the GC |
1 dedicated GC thread per processor |
|
EE Suspension |
EE is suspended much shorter but several times during a GC |
EE is suspended during a GC |
EE is suspended during a GC |
|
Config setting |
<gcConcurrent enabled="true"> |
<gcConcurrent enabled="false"> |
<gcServer enabled="true"> |
|
On a single proc |
WS GC + non-concurrent |
垃圾收集(garbage collection ,GC)的代价是什么,如何保证代价最小?
可以使用一些不同的计数器来衡量一个应用程序的GC的消耗。记住,所有这些计数器都是在收集结束之后更新的,这意味着你使用中会发现过了很长的一个不活动期,那些数据才可靠的。
l NET CLR Memory"% time in GC
这个计数器衡量GC花费的cpu时间的数量,计算方式是: GC时间/自上次GC后的cpu时间
l .NET CLR Memory"# Induced GC
这个是自有人调用GC.Collect()以来的垃圾收集的次数。完美情况下,应该是0,因为含有收集行为表示你花费了很多时间在GC上,而且因为GC不断的调整自己来适应收集模式,而手动的收集会使优化性能降低。
l .NET CLR Memory"# Gen X collections
这个计数器显示了给定代的收集数量。因为Gen 2 的收集代价比Gen 1 和 Gen 0 要高很多,相对于 Gen1 , Gen 0 你想要更少的 Gen 2 的收集次数,Gen 2 : Gen 1 :Gen 0=1:10:100是比较理想的。
大多数常见的是在GC时导致高cpu、或相对于Gen 1 和 Gen 0 ,Gen 2较高的收集次数的情况。这些情况是频繁的分配大对象,还有就是让对象在许多不同代之间存活的结果,因为不合适的使用终结器(finalizer)或者因为要终结对象没有被正确的销毁 就会导致这种情况发生。
南来地,北往的,上班的,下岗的,走过路过不要错过!
======================个性签名=====================
之前认为Apple 的iOS 设计的要比 Android 稳定,我错了吗?
下载的许多客户端程序/游戏程序,经常会Crash,是程序写的不好(内存泄漏?刚启动也会吗?)还是iOS本身的不稳定!!!
如果在Android手机中可以简单联接到ddms,就可以查看系统log,很容易看到程序为什么出错,在iPhone中如何得知呢?试试Organizer吧,分析一下Device logs,也许有用.


【推荐】国内首个AI IDE,深度理解中文开发场景,立即下载体验Trae
【推荐】编程新体验,更懂你的AI,立即体验豆包MarsCode编程助手
【推荐】抖音旗下AI助手豆包,你的智能百科全书,全免费不限次数
【推荐】轻量又高性能的 SSH 工具 IShell:AI 加持,快人一步
· TypeScript + Deepseek 打造卜卦网站:技术与玄学的结合
· 阿里巴巴 QwQ-32B真的超越了 DeepSeek R-1吗?
· 【译】Visual Studio 中新的强大生产力特性
· 【设计模式】告别冗长if-else语句:使用策略模式优化代码结构
· 10年+ .NET Coder 心语 ── 封装的思维:从隐藏、稳定开始理解其本质意义
2015-02-13 ArrowLayer : A coustom layer animation