
GFlags
在何处获取 GFlags
GFlags 包含在适用于 Windows 10 (WinDbg) 的调试工具中。
安装调试工具后,默认在以下目录中安装 64 位版本的 gflags.exe。
C:\Program Files (x86)\Windows Kits\10\Debuggers\x64
如果你运行的是 32 位版本的 Windows,请使用位于此处的 32 位版本的gflags.exe:
C:\Program Files (x86)\Windows Kits\10\Debuggers\x86
GFlags 概述
驱动程序开发人员和测试人员通常使用 GFlags 直接或通过在测试脚本中包含 GFlags 命令来启用调试、日志记录和测试功能。 页堆验证功能可以帮助你识别内核模式驱动程序中的内存泄漏和缓冲区错误。
GFlags 具有对话框和命令行接口。 这两个接口都提供大多数功能,但某些功能只能从其中一个接口访问。 有关详细信息,请参阅 GFlags 详细信息。
功能
-
页堆验证。 GFlags 现在包括 (pageheap.exe) 的功能
PageHeap,该工具支持堆分配监视。PageHeap包含在以前版本的 Windows 中。 -
特殊池功能无需重启。 在 Windows Vista 和更高版本的 Windows 上,可以启用、禁用和配置特殊池功能,而无需重启 (“重新启动”) 计算机。 有关详细信息,请参阅 特殊池。
-
对象引用跟踪。 新标志允许跟踪内核中的对象引用和对象取消引用。 此功能可检测对象引用计数递减次数过多或未递减(即使不再使用对象)。 此标志仅在 Windows Vista 和更高版本的 Windows 中受支持。
-
新建对话框设计。 GFlags 对话框具有选项卡式页面,以便于导航。
要求
若要使用大多数 GFlags 功能,包括在注册表或内核模式下设置标志,或启用页面堆验证,你必须是计算机上的管理员组的成员。 但是,在 Windows Vista 之前,至少具有来宾帐户访问权限的用户可以从“ 全局标志 ”对话框启动程序。
GFlags Overview
For information on how to install and locate gflags.exe, see GFlags.
Use GFlags to activate the following features:
Registry
Set system-wide debugging features for all processes running on the computer. These settings are stored in the GlobalFlag registry entry (HKEY_LOCAL_MACHINE\SYSTEM\CurrentControlSet\Control\Session Manager\GlobalFlag). They take effect when you restart Windows and remain effective until you change them and restart again.
Kernel flag settings
Set debugging features for this session. These settings are effective immediately, but are lost when Windows shuts down. The settings affect all processes started after this command completes.
Image file settings
Set debugging features for a particular program. These settings are stored in a GlobalFlag registry entry for each program (HKEY_LOCAL_MACHINE\ SOFTWARE\ Microsoft\ Windows NT\ CurrentVersion\ Image File Execution Options\ ImageFileName\ GlobalFlag). They take effect when you restart the program and remain effective until you change them.
Debugger
Specify that a particular program always runs in a debugger. This setting is stored in the registry. It is effective immediately and remains effective until you change it. (This feature is available only in the Global Flags dialog box.)
Launch
Run a program with the specified debugging settings. The debugging settings are effective until the program stops. (This feature is available only from the Global Flags dialog box.)
Special Pool
Request that allocation with a specified pool tag or of a specified size are filled from the special pool. This feature helps you to detect and identify the source of errors in kernel pool use, such as writing beyond the allocated memory space, or referring to memory that has already been freed.
Beginning in Windows Vista, you can enable, disable, and configure the special pool feature (Kernel Special Pool Tag) as a kernel flags setting, which does not require a reboot, or as a registry setting, which requires a reboot.
Page heap verification
Enable, disable, and configure page heap verification for a program. When enabled, page heap monitors dynamic heap memory operations, including allocation and free operations, and causes a debugger break when it detects a heap error.
Silent process exit
Enable, disable, and configure monitoring and reporting of silent exits for a process. You can specify actions that occur when a process exits silently, including notification, event logging, and creation of dump files. For more information, see Monitoring Silent Process Exit.
监视静默进程退出
在此监视功能的上下文中,我们使用术语 无提示退出 表示受监视进程以下列方式之一终止。
自我终止
监视的进程通过调用 ExitProcess 来终止自身。
跨进程终止
第二个进程通过调用 TerminateProcess 终止受监视的进程。
监视功能不会检测到进程最后一个线程退出时发生的正常进程终止。 监视功能不会检测由内核模式代码启动的进程终止。
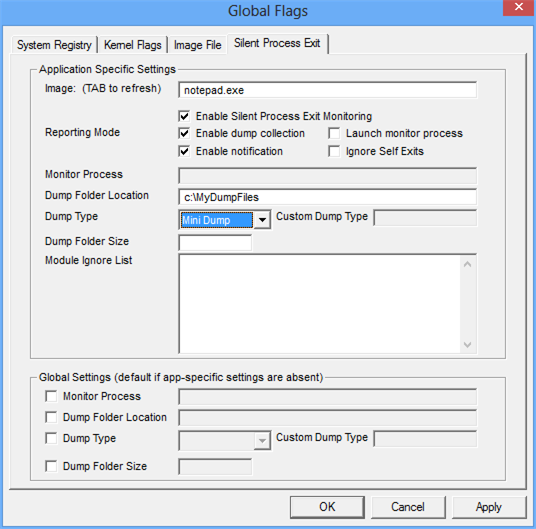
若要注册用于无提示退出监视的进程,请在 GFlags 中打开 “无提示进程退出 ”选项卡。 输入进程名称作为 图像 ,然后按 Tab 键。 选中“ 启用无提示进程退出监视 ”框,然后选择“ 应用”。 这会设置以下注册表项中的FLG_MONITOR_SILENT_PROCESS_EXIT标志。
HKLM\SOFTWARE\Microsoft\Windows NT\CurrentVersion\Image File Execution Options\ProcessName\GlobalFlag
有关此标志的详细信息,请参阅 启用无提示进程退出监视。
有关在 GFlags 中使用 无提示进程退出 选项卡的详细信息,请参阅 配置无提示进程退出监视。
在 GFlags 的 “无提示进程退出 ”选项卡中,可以配置在监视的进程以无提示方式退出时将执行的操作。 可以配置通知、事件日志记录和转储文件的创建。 可以指定在检测到无提示退出时启动的进程,并且可以指定监视器将忽略的模块列表。 其中几个设置可全局和单个应用程序使用。 全局设置适用于注册无提示退出监视的所有进程。 应用程序设置适用于单个进程并替代全局设置。
全局设置存储在注册表中的以下密钥下。
HKEY_LOCAL_MACHINE\SOFTWARE\Microsoft\Windows NT\CurrentVersion\SilentProcessExit
应用程序设置存储在注册表中的以下密钥下。
HKEY_LOCAL_MACHINE\SOFTWARE\Microsoft\Windows NT\CurrentVersion\SilentProcessExit\ProcessName
报告模式
报告模式设置可用作应用程序设置,但不能用作全局设置。 可以使用以下复选框来设置报告模式。
启动监视器processEnable 转储集合Enable通知ReportingMode 注册表项是以下标志的按位 OR。
| 标志 | 值 | 含义 |
|---|---|---|
| LAUNCH_MONITORPROCESS | 0x1 | 检测到无提示退出后,启动“ 监视进程 ”框中指定的监视进程 () 。 |
| LOCAL_DUMP | 0x2 | 检测到无提示退出时,将为受监视的进程创建转储文件。 对于跨进程终止,还会为导致终止的进程创建转储文件。 |
| 通知 | 0x4 | 检测到无提示退出后,将显示弹出通知。 |
忽略自退出
“忽略自退出”设置可用作应用程序设置,但不能用作全局设置。 可以使用“ 忽略自退出 ”复选框指定是否忽略自退出。
IgnoreSelfExits 注册表项具有以下值之一。
| 值 | 含义 |
|---|---|
| 0x0 | 检测并响应自我终止和跨进程终止。 |
| 0x1 | 忽略自终止。 检测并响应跨进程终止。 |
监视进程
可以通过在 “监视进程 ”文本框中输入进程名称以及命令行参数来指定监视进程。 可以在命令行中使用以下变量。
| Varaible | 含义 |
|---|---|
| %e | 退出进程的 ID。 这是以无提示方式退出的受监视进程。 |
| %i | 发起进程的 ID。 在自我终止的情况下,这与退出过程相同。 对于跨进程终止,这是导致终止的进程 ID。 |
| %t | 发起线程的 ID。 这是导致终止的线程。 |
| %c | 传递给 ExitThread 或 TerminateThread 的状态代码。 |
例如, Monitor Process 的以下值指定在无提示退出时,将启动 WinDbg 并将其附加到退出进程。
windbg -p %e
Monitor Process 命令行存储在 MonitorProcess 注册表项中。
转储文件夹位置
可以使用 转储文件夹位置 文本框指定在检测到无提示退出时写入的转储文件的位置。
为 Dump 文件夹位置 输入的字符串存储在 LocalDumpFolder 注册表项中。
如果未指定转储文件夹位置,转储文件将写入默认位置,即 %TEMP%\无提示进程退出。
转储文件夹大小
可以使用 转储文件夹大小 文本框指定可写入转储文件夹的最大转储文件数。 以十进制整数形式输入此值。
为 Dump 文件夹大小 输入的值存储在 MaximumNumberOfDumpFiles 注册表项中。
默认情况下,对可以写入的转储文件数没有限制。
转储类型
可以使用 转储类型 下拉列表指定在检测到无提示退出时写入的转储文件类型 (Micro、Mini、Heap 或 Custom) 。
转储类型存储在 DumpType 注册表项中,这是MINIDUMP_TYPE枚举的成员的按位 OR。 此枚举在 dbghelp.h 中定义,该枚举包含在 Windows 包的调试工具中。
例如,假设你选择了 Micro 的转储类型,并且会看到 DumpType 注册表项的值为 0x88。 值0x88为以下两 个MINIDUMP_TYPE 枚举值的按位 OR。
MiniDumpFilterModulePaths:0x00000080
MiniDumpFilterMemory:0x00000008
如果选择自定义转储类型的转储类型,请在“自定义转储类型”框中输入自己的按位或MINIDUMP_TYPE枚举值。 以十进制整数形式输入此值。
模块忽略列表
可以使用 “模块忽略列表 ”框指定在检测到无提示退出时将被忽略的模块列表。 如果受监视的进程由此列表中的某个模块终止,则忽略无提示退出。
在 “模块忽略列表 ”框中输入的模块列表存储在 ModuleIgnoreList 注册表项中。
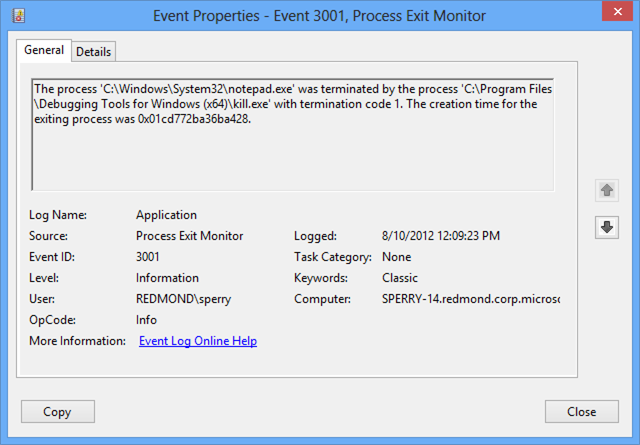
在 事件查看器 中读取进程退出报告
当受监视的进程以无提示方式退出时,监视器会在事件查看器中创建一个条目。 若要打开事件查看器,请输入命令 eventvwr.msc。 导航到Windows日志>应用程序。 查找具有进程退出监视器 源 的日志条目。
Configuring Silent Process Exit Monitoring
Beginning in Windows 7, you can use the Silent Process Exit tab to enable and configure monitoring of silent exit for a process.
Settings that you specify in the Silent Process Exit tab are saved in the registry and remain effective until you change them.
To enable and configure silent process exit monitoring
-
Click the Silent Process Exit tab.
The following screen shot shows the Silent Process Exit tab in Windows 8.
-
In the Image box, type the name of an executable file, including the file name extension, and then press the TAB key.
This activates the check boxes on the Silent Process Exit tab.
-
Specify your preferences by selecting or clearing check boxes and by entering values in text boxes.
-
When you specified all of your preferences, click Apply.
Launching a Program with Flags
This feature runs a program once with the specified flags. These settings affect only the instance of the program launched. They are not saved in the registry.
To launch a program with flags
-
Click the Image File tab.
-
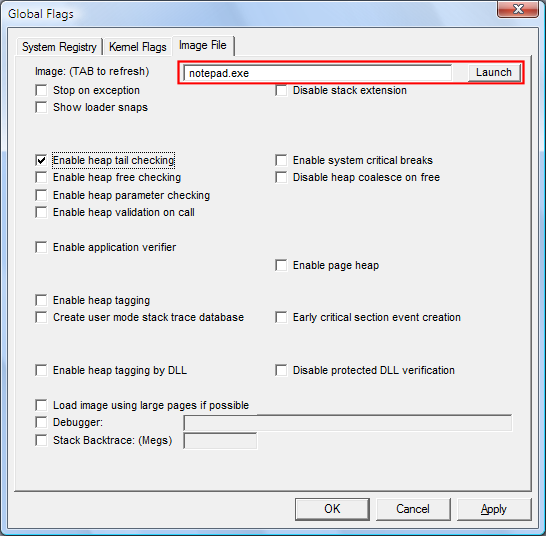
In the Image box, type the name of an executable file or DLL, including the file name extension, and any commands for the program, and then press the TAB key.
This activates the Launch button and the check boxes on the Image File tab.
-
Set or clear a flag by selecting or clearing the check box associated with the flag.
-
Click the Launch button.
The following screen shot shows the Launch button on the Image File tab in Windows Vista.
Note Flags set in the registry do not affect the instance of the program that is launched. Flags set in the dialog box are used for the launched instance even when they are not image file flags.
Running a Program in a Debugger
This feature configures the program so that it always runs in a debugger with the specified options. This setting is saved in the registry. It affects all new instances of the program and remains effective until you change it.
To run a program in a debugger
-
Click the Image File tab.
-
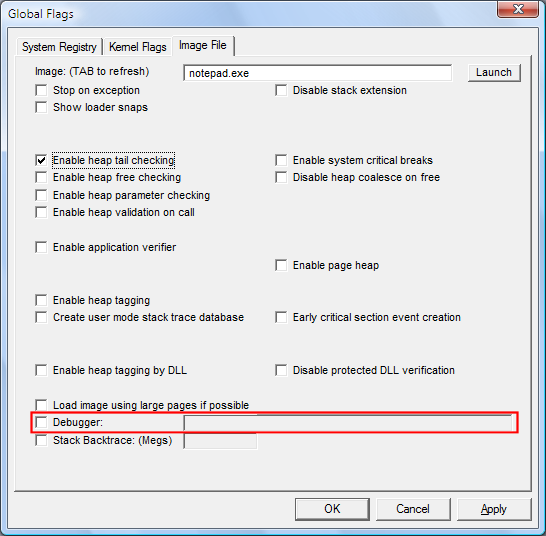
In the Image box, type the name of an executable file or DLL, including the file name extension,and then press the TAB key.
This activates the check boxes on the Image File tab.
-
Click the Debugger check box to select it.
The following screen shot shows the Debugger check box on the Image File tab in Windows Vista.
-
In the Debugger box, type the command to run the debugger, including the path (optional) and name of the debugger and parameters. For example, ntsd -d -g -G -x or c:\debuggers\cdb.exe -g -G.
-
Click Apply.
Windbg的gflags.exe -- Attach调试利器
有没有碰到过程序启动就因为异常直接crash?有没有碰到程序启动之后什么反应也没有?有没有碰到过程序启动之后去触发另一个进程失败?有没有碰到别人的程序调用了你的代码,出现问题以后,让你来调查,而你只有你的源代码,该怎么办?
碰过这样的问题,应该都会很头疼吧,如何诊断问题呢?最简单的当然是Debug吧,可是当程序没有启动的时候,我们不能Attach to process...因为进程还不存在。但如果等启动程序再Attach,启动时的代码段早就过了。
当然你还有一种选择,就是写Log,但是Log的信息都是有限的,而且没有单步调试,很难跟踪到错误的原因。
所以,对我们程序员来说,最简单当然是Debug。该怎么办呢?我们需要就是gflags.exe。该怎么用呢?
- 首先你需要安装Debugging Tools for Windows (http://msdn.microsoft.com/en-us/windows/hardware/gg463009)。里面有大名鼎鼎的Windbg哦,不过今天要用的是其中的gflag.exe。
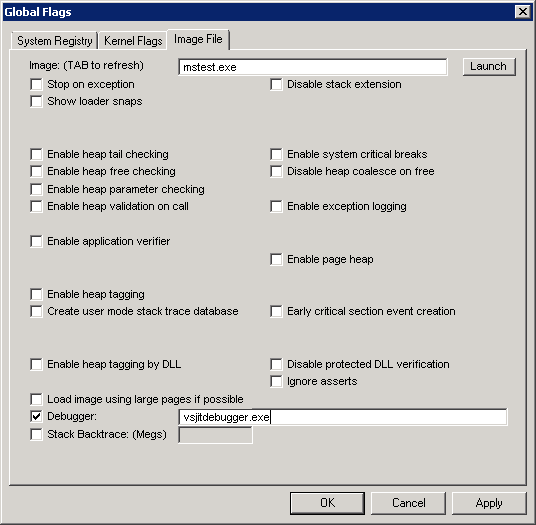
- 双击打开gflags.exe,选择Image File标签。
- 在Image栏里输入你希望调试的程序名。比如,mstest.exe。(按Tab)
- 勾选Debugger并输入vsjitdebugger.exe。
- 点击OK或者Apply。
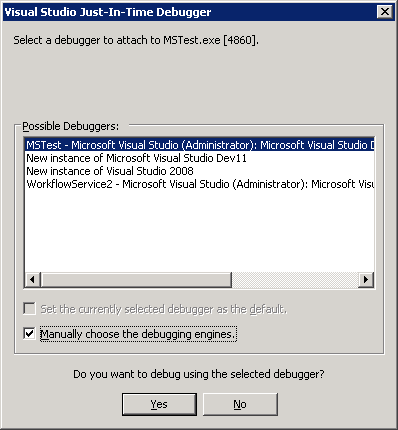
- 再次启动你的程序吧,这时候就可以看到VS Debugger的调试选框。
- 勾选“Manually choose the debugging engines”选框。
- 并选择打开你的代码的VS。
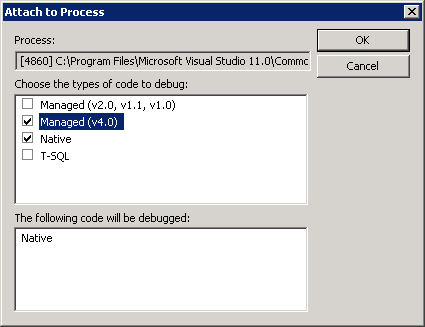
- 选择你的Debugger engine吧,如果你是.net 4.0的代码,那么就选择Managed (v4.0)。
南来地,北往的,上班的,下岗的,走过路过不要错过!
======================个性签名=====================
之前认为Apple 的iOS 设计的要比 Android 稳定,我错了吗?
下载的许多客户端程序/游戏程序,经常会Crash,是程序写的不好(内存泄漏?刚启动也会吗?)还是iOS本身的不稳定!!!
如果在Android手机中可以简单联接到ddms,就可以查看系统log,很容易看到程序为什么出错,在iPhone中如何得知呢?试试Organizer吧,分析一下Device logs,也许有用.


 浙公网安备 33010602011771号