根本原因:
在gdyj.dll中,估计是dllmain函数里执行的代码触发了某些异常,它是在程序启动之前就运行导至VS调试也启动不来了。
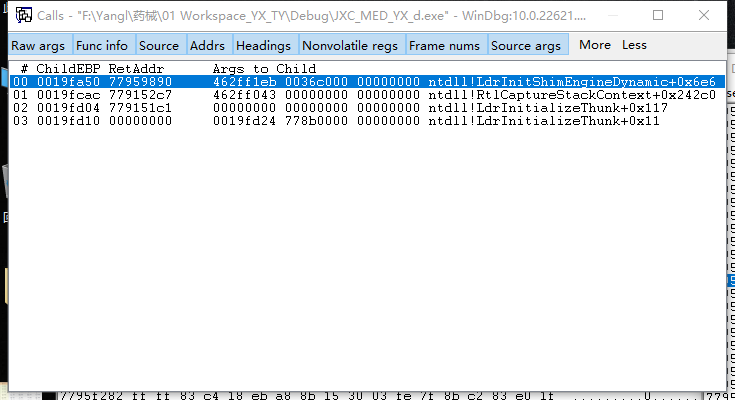
0:000> ba r 2 0x7795f0f6
0:000> bl
     0 e Disable Clear  7795f0f6 r 2 0001 (0001)  0:**** ntdll!LdrInitShimEngineDynamic+0x6e6

7795f0df 6a11            push    11h
7795f0e1 6afe            push    0FFFFFFFEh
7795f0e3 e8e817fcff      call    ntdll!NtQueryInformationThread (779208d0)
7795f0e8 85c0            test    eax,eax
7795f0ea 781b            js      ntdll!LdrInitShimEngineDynamic+0x6f7 (7795f107)
7795f0ec 807de700        cmp     byte ptr [ebp-19h],0
7795f0f0 7515            jne     ntdll!LdrInitShimEngineDynamic+0x6f7 (7795f107)
7795f0f2 8365fc00        and     dword ptr [ebp-4],0
7795f0f6 cc              int     3
7795f0f7 eb07            jmp     ntdll!LdrInitShimEngineDynamic+0x6f0 (7795f100)
7795f0f9 33c0            xor     eax,eax
7795f0fb 40              inc     eax
7795f0fc c3              ret
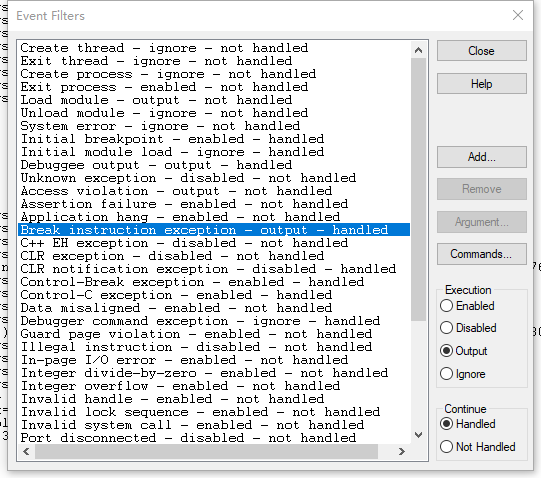
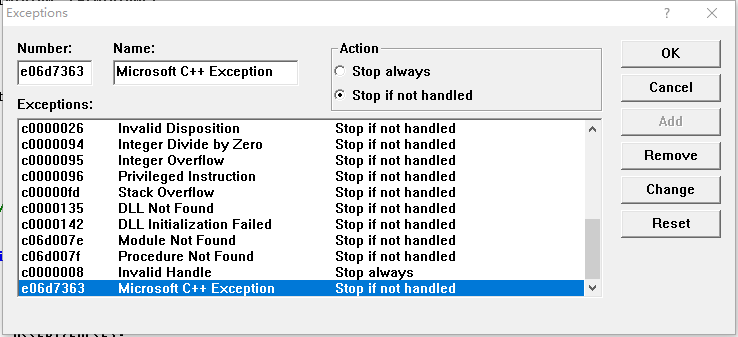
VC6里没有啊。。。断点模式下, 我们自定义一个80000003进去。

(1754.3058): Break instruction exception - code 80000003 (first chance)
eax=00000000 ebx=0024c000 ecx=2d550000 edx=00000000 esi=01703200 edi=778c37ec
eip=7795f0f6 esp=0019fa24 ebp=0019fa50 iopl=0         nv up ei pl zr na pe nc
cs=0023  ss=002b  ds=002b  es=002b  fs=0053  gs=002b             efl=00000246
ntdll!LdrpDoDebuggerBreak+0x2b:
7795f0f6 cc              int     3
0:000> .restart /f

CommandLine: "JXC_MED_YX_d.exe"

************* Path validation summary **************
Response                         Time (ms)     Location
Deferred                                       srv*
Symbol search path is: srv*
Executable search path is:
ModLoad: 00400000 0140c000   JXC_MED_YX_d.exe
ModLoad: 778b0000 77a4c000   ntdll.dll
ModLoad: 75e80000 75f60000   C:\WINDOWS\SysWOW64\KERNEL32.DLL
ModLoad: 75610000 7580b000   C:\WINDOWS\SysWOW64\KERNELBASE.dll
ModLoad: 77560000 776f9000   C:\WINDOWS\SysWOW64\USER32.dll
ModLoad: 77480000 77497000   C:\WINDOWS\SysWOW64\win32u.dll
。。。。。
(4114.1b58): Break instruction exception - code 80000003 (first chance) //此异常我们只OUTPUT 不中断,即可跳过
ModLoad: 77700000 77725000   C:\WINDOWS\SysWOW64\IMM32.DLL
user breakpoint at visual studio 6.0
I have been using Visual Studio 6.0, and last week my computer was upgraded from Windows 7 to Windows 10.
There was no problem in executing an application made from VS6.0, but now I am struggling to fix a problem with this message:
"user breakpoint called at 0x77badadf".
This message happens even before the starting point of the problem - main() -, and I am not able to do anything about this problem. What is strange is that it doesn't appear when I do "rebuild all" for all the projects in the solution.
Any ideas on how to solve this?
-
Did you ever find out what this was? I have to maintain an old project with Visual C++ 6 and even a rebuild all does not fix it.– DonovanMay 2, 2019 at 18:03
-
The problem here is that Microsoft are shimming MSDEV.EXE, but not fully. The old trick of renaming it to something else and manually setting compatibility settings alongside replacing TLLOC.DLL, which worked up to Windows 8.x, no longer works because they seem to now detect it via something more than just the EXE name. So VC++ 6.0 works out of the box under Windows 10 (with the TLLOC.DLL fix) but then dies with the "user breakpoint called" error. It looks like they made an effort to get it working, but never tested it beyond "it starts up OK".– DaveOct 5, 2019 at 4:46
-
1I duplicated this with an old hard drive, installed Win10 out of the box, installed VC6 plus SP6, and it fails to allow me to run in the debugger. But ONLY when one DLL is inside another DLL. Rather odd. I have another open post on this issue. stackoverflow.com/questions/60105658/….. Any progress on this?– SpacemanScottFeb 8, 2020 at 16:48
User breakpoint called from code at....???
And how to prevent it....
"User breakpoint called from code at 0x77f7629c"
I have no breakpoints set anywhere in the code.
The stack trace is:
NTDLL! 77f7629c()
NTDLL! 77f8c4de()
NTDLL! 77f7e587()
NTDLL! 77f64f43()
MYDLL! free + 45 bytes
operator delete(void * 0x00440380) line 7 + 9 bytes
std::allocator<char>::deallocate(void * 0x00440380, unsigned int 33) line 64 + 38 bytes
std::basic_string<char,std::char_traits<char>,std::allocator<char> >::_Tidy(unsigned char 1) line 592
std::basic_string<char,std::char_traits<char>,std::allocator<char> >::~basic_string<char,std::char_traits<char>,std::allocator<char> >() line 59 + 39 bytes
myClass::myMethod(std::basic_string<char,std::char_traits<char>,std::allocator<char> > {0x00440381 "ABC"}) line 6 + 8 bytes
main(int 1, char * * 0x00440eb0) line 7
MYAPP! mainCRTStartup + 180 bytes
KERNEL32! 77f1ba06()
myapp.cpp
---------
#include "mydll.h"
int
main(int argc,char *argv[])
{
myClass x;
x.myMethod("ABC");
return 0;
}
myfml.cpp
---------
#pragma warning(disable : 4251)
#ifdef _MYDLL
#define MY_DLL __declspec(dllexport)
#else
#define MY_DLL __declspec(dllimport)
#endif
#include <string>
using namespace std;
class MY_DLL myClass {
public:
void myMethod(string myString);
};
myfml.h
---------
#define _MYDLL
#include "mydll.h"
void
myClass::myMethod(string myString)
{
}
__asm int 3;
in your code. This will always invoke the debugger, you don't have manually to set a breakpoint on this line.
The debugger is finding such a line, probably because an error is being detected.
What that error is, I can't say. But it does look like it might be havign trouble deleting memory.
The problem probably originates in MyMethod, although it is detected "lower down" If you post the code for MyMethod it might help.
*************************************
The problem is that if the EXE and DLL use the staticly linked version of the run-time library (RTL), they each have their own seperate copies of the RTL. These copies each have thier own seperate heaps for allocating memory with the new operator. The problem is that each one does not "know" about the other. So for example, if the DLL allocates memory, the memory comes from the heap in the DLL's copy of the RTL. If a pointer to that memory is passed back to the EXE (it may be passed in a subtle way, like inside a class) and if that EXE later makes changes that require that the memory specified by the pointer be deleted, then the EXE will try to delete the memory, but will not be able to find the memory inside its heap. This is is because the memory did not come from the heap. Hence the problem.
The solution is to have the EXE and all the C++ DLLS that it uses link with the DLL version of the RTL.
Then the EXE and all the DLLS will share a single copy of the run-time library and will therefore share a single heap.
To set this in VC:
"Project" menu
"Settings..." menu item
in the dialog box that appears "C/C++" tab
"Code generation" Category
in "Use run-time library:" select one of the DLL options.
(There are two DLLoptions there, one for a debug version, one for a release version. Make sure you choose the setting that is right for the version you are creating)
Note that these settings need to be changed for EVERY version (debug. release etc) of the EXE and and DLLs that is shares memory with.
******************************
The reason this applies to you is that the string class uses dynamically allocated memory to store the string. Initially the application creates this memory but the DLL tries to delete it and runs into problems, because it was not allocated on the right heap.
Let me know if you have any questions.
One last question just to clear up the "what library I shoudl link with question"...
I have a workspace called "bug" with two projects: "myapp" and "mydll"
myapp project contains: myapp.cpp
mydll project contains: mydll.h and mydll.cpp
Which combinations of libraries should I use for Debug/Release for each project: myapp and mydll?
After your post I set them to:
Debug Release
---------------------- ----------------------
myapp Debug mutithreaded DLL Mutithreaded DLL
mydll Debug mutithreaded DLL Mutithreaded DLL
Should I have it like this instead?:
Debug Release
---------------------- ----------------------
myapp Debug mutithreaded Mutithreaded
mydll Debug mutithreaded DLL Mutithreaded DLL
When would I use single threaded? (I dont intead to write
any multithreaded apps) must I always link multithreaded
for the classes that I may use like "string"?
Cheers
Paul
The DLL RTL is always multi-threaded as you can see.
For this project you must use the DLL vesion, so you have to use the multi-threaded version too, though you don't need the multi-threaded features.
Actually you do need them, due to the nature of DLLs, your program might not be multi-threaded, but the DLL will potentially be used by other programs simultaneously, so it is in a sense multi-threaded.
You can use the static, single-threaded libs for a program that does not share dynamcially allocated memory and that is single-threaded.
i.e. a program composed of a EXE that doesn't relly on any DLLs that you've written.
Or maybe a DLL program that doesn't pass/return dynamically allocated memory that the client of the DLL must free, or vice versa.
I just did a full recompile of the actual application (not the dummy app I used to pose the question) had a warning when I changed all the projects in the workspace to "Debug Multithreaded DLL"
The problem is in a third party header from BEA systems (Tuxedo) - its originally from a unix box but has been modified to compile on windows.
The warning I get is
c:\tuxedo\include\uunix.h(117) : warning C4273: 'strdup' : inconsistent dll linkage. dllexport assumed.
And the relevant header file is:
....
extern "C" {
extern char *strdup(const char *);
#if defined(__cpp_stdc)
extern int setpgid(pid_t, pid_t);
#endif
#if !defined(_TMDOWN)
extern char *tempnam(const char *, const char *);
#endif
}
....
If not, you will just have to ignore the warning and hope for the best. Don't ever use the strdup() it declares (you can remove it from the header to prevent accidental usage and to remove the warning message.). As long as this lib never expects you to free memory you allocate (or vice versa) you will be fine. But if it does, it will fail. There's nothing that can be done about that other than recompilation to use the DLL RTL, but if you don't have the source, that is not a option. You might be able to get the producers of the LIB to do so for you.
I actually work for BEA, the company that writes the software. Although I don't have access to the code I can pass along the info and maybe they will fix it in future releases.
Thanks for your help.
0:000> bp KERNELBASE!SetUnhandledExceptionFilter

0:000> g
ModLoad: 77390000 773b5000   C:\WINDOWS\SysWOW64\IMM32.DLL
Breakpoint 0 hit
eax=00000000 ebx=76f00590 ecx=100e357c edx=00285000 esi=1012081c edi=00004563
eip=7753de90 esp=0019f880 ebp=0019f8b4 iopl=0         nv up ei pl nz na po nc
cs=0023  ss=002b  ds=002b  es=002b  fs=0053  gs=002b             efl=00000202
KERNELBASE!SetUnhandledExceptionFilter:
7753de90 8bff            mov     edi,edi

0:000> kvf
  Memory  ChildEBP RetAddr  Args to Child
          0019f87c 100e3587 100e3510 100dd564 015cb888 KERNELBASE!SetUnhandledExceptionFilter (FPO: [Non-Fpo])
WARNING: Stack unwind information not available. Following frames may be wrong.
       38 0019f8b4 100da0d4 10000000 00000002 0000000a gzyj!DownloadData+0xc5c77
       40 0019f8f4 100da18e 10000000 776a0646 10000000 gzyj!DownloadData+0xbc7c4
       28 0019f91c 7766f66c 100da171 10000000 00000001 gzyj!DownloadData+0xbc87e
       4c 0019f968 7767c8bc 00000001 0019fd24 f600d1d4 ntdll!LdrpCallInitRoutine+0x55 (FPO: [Non-Fpo])
       90 0019f9f8 7767cb2f 015b6b10 015b6a88 015d8ef8 ntdll!LdrpInitializeNode+0x139 (FPO: [Non-Fpo])
       24 0019fa1c 7767cb46 0019fa3b 776437ec 76f00400 ntdll!LdrpInitializeGraphRecurse+0x5d (FPO: [Non-Fpo])
       24 0019fa40 776d9bc0 0019fa4f 005b6a88 0019fcac ntdll!LdrpInitializeGraphRecurse+0x74 (FPO: [Non-Fpo])
       10 0019fa50 776d99b3 f600d480 00282000 00000000 ntdll!LdrpInitializeGraph+0x13 (FPO: [Non-Fpo])
      25c 0019fcac 776952c7 f600d528 00000000 00000000 ntdll!LdrpInitializeProcess+0x1c43 (FPO: [Non-Fpo])
       58 0019fd04 776951c1 00000000 00000000 00000000 ntdll!_LdrpInitialize+0xb0 (FPO: [Non-Fpo])
        c 0019fd10 00000000 0019fd24 77630000 00000000 ntdll!LdrInitializeThunk+0x11 (FPO: [Non-Fpo])
ntdll!RtlAllocateHeap ntdll!RtlEnterCriticalSection ntdll!_except_handler4 ntdll!RtlDecodePointer ntdll!RtlSizeHeap
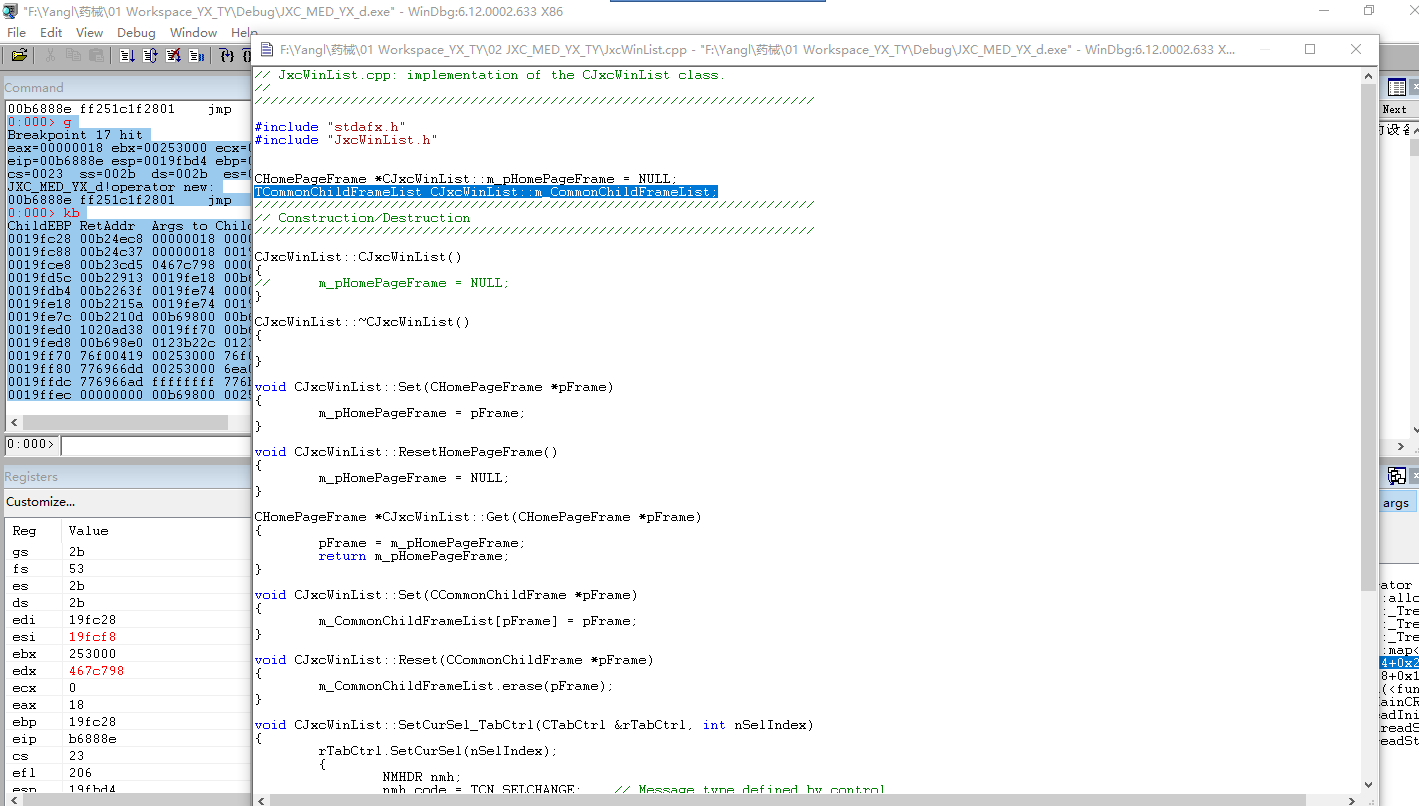
0:001> x *!operator*new
00b68684 JXC_MED_YX_d!operator new = <no type information>
00b6888e JXC_MED_YX_d!operator new = <no type information>
0:001> bp 00b68684 ;bp 00b6888e ;
0:000> g
Breakpoint 17 hit
eax=00000018 ebx=00253000 ecx=00000000 edx=0467c798 esi=0019fcf8 edi=0019fc28
eip=00b6888e esp=0019fbd4 ebp=0019fc28 iopl=0         nv up ei pl nz na pe nc
cs=0023  ss=002b  ds=002b  es=002b  fs=0053  gs=002b             efl=00000206
JXC_MED_YX_d!operator new:
00b6888e ff251c1f2801    jmp     dword ptr [JXC_MED_YX_d!_imp_??2YAPAXIZ (01281f1c)] ds:002b:01281f1c={MFC42D!operator new (5f4299a9)}
0:000> kb
ChildEBP RetAddr  Args to Child
0019fc28 00b24ec8 00000018 00000000 0019fce8 JXC_MED_YX_d!operator new
0019fc88 00b24c37 00000018 0019fd50 0019fcf8 JXC_MED_YX_d!std::allocator<CCommonChildFrame *>::_Charalloc+0x28 [e:\program files (x86)\microsoft visual studio\vc98\include\xmemory @ 62]
0019fce8 00b23cd5 0467c798 00000000 0019fdb4 JXC_MED_YX_d!std::_Tree<CCommonChildFrame *,std::pair<CCommonChildFrame * const,CCommonChildFrame *>,std::map<CCommonChildFrame *,CCommonChildFrame *,std::less<CCommonChildFrame *>,std::allocator<CCommonChildFrame *> >::_Kfn,std::less<CCommonChildFrame *>,std:7c1b4048+0x27 [e:\program files (x86)\microsoft visual studio\vc98\include\xtree @ 578]
0019fd5c 00b22913 0019fe18 00b69800 00253000 JXC_MED_YX_d!std::_Tree<CCommonChildFrame *,std::pair<CCommonChildFrame * const,CCommonChildFrame *>,std::map<CCommonChildFrame *,CCommonChildFrame *,std::less<CCommonChildFrame *>,std::allocator<CCommonChildFrame *> >::_Kfn,std::less<CCommonChildFrame *>,std:20049d9c+0xe5 [e:\program files (x86)\microsoft visual studio\vc98\include\xtree @ 459]
0019fdb4 00b2263f 0019fe74 00000000 0019fe78 JXC_MED_YX_d!std::_Tree<CCommonChildFrame *,std::pair<CCommonChildFrame * const,CCommonChildFrame *>,std::map<CCommonChildFrame *,CCommonChildFrame *,std::less<CCommonChildFrame *>,std::allocator<CCommonChildFrame *> >::_Kfn,std::less<CCommonChildFrame *>,std:155bc752+0x43 [e:\program files (x86)\microsoft visual studio\vc98\include\xtree @ 160]
0019fe18 00b2215a 0019fe74 0019fe78 0019fed0 JXC_MED_YX_d!std::map<CCommonChildFrame *,CCommonChildFrame *,std::less<CCommonChildFrame *>,std::allocator<CCommonChildFrame *> >::map<CCommonChildFrame *,CCommonChildFrame *,std::less<CCommonChildFrame *>,std::allocator<CCommonChildFrame *> >+0x2f [e:\program files (x86)\microsoft visual studio\vc98\include\map @ 57]
0019fe7c 00b2210d 00b69800 00b69800 00253000 JXC_MED_YX_d!$E874+0x2a [F:\Yangl\药械\01 Workspace_YX_TY\02 JXC_MED_YX_TY\JxcWinList.cpp @ 10]
0019fed0 1020ad38 0019ff70 00b698e0 0123b22c JXC_MED_YX_d!$E878+0x1d
0019fed8 00b698e0 0123b22c 0123b5f0 00b69800 MSVCRTD!_initterm+0x18 [crt0dat.c @ 525]
0019ff70 76f00419 00253000 76f00400 0019ffdc JXC_MED_YX_d!WinMainCRTStartup+0xe0 [crtexe.c @ 274]
0019ff80 776966dd 00253000 6ea0a04a 00000000 KERNEL32!BaseThreadInitThunk+0x19
0019ffdc 776966ad ffffffff 776b53d5 00000000 ntdll!__RtlUserThreadStart+0x2f
0019ffec 00000000 00b69800 00253000 00000000 ntdll!_RtlUserThreadStart+0x1b
*memory address* int 3
The odd thing is, there is NOWHERE in the code that I am calling an assembly instruction like this (I think asm int 3 is a hardware break command for x86?)..
what could be causing this?
EDIT: ANSWER: My code was "walking off the end" of an array, but only in the locations marked by Visual Studio debug with 0xFDFDFDFD, which is called a NoMan'sLand fence.. I think its also called an Off-by-one error.. This array was unrelated to the point where i was freeing the memory when the error was occuring. Which made it harder to spot.. :(
User Breakpoint Called From Code At 0X7c90120120e
I'm debugging a code in VS that I wrote in C. For some reason, at some point it jumps to an assembly window with the following line:
int 3
And a pop up message box appears with the following message:
User Breakpoint Called From Code At 0X7c90120120e
I looked at the stack, and the command that caused that was MALLOC !
In output window:
Heap missing last entry in committed range near 22549c0
The weird thing is, when I press OK at the message then F5 to continue debugging it continues and everything works 100%. But when I try to execute the code I get a message that my project encountered some problem.
I tried cleaning my project, rebuilding, removing all breakpoints .. nothing worked.
南来地,北往的,上班的,下岗的,走过路过不要错过!
======================个性签名=====================
之前认为Apple 的iOS 设计的要比 Android 稳定,我错了吗?
下载的许多客户端程序/游戏程序,经常会Crash,是程序写的不好(内存泄漏?刚启动也会吗?)还是iOS本身的不稳定!!!
如果在Android手机中可以简单联接到ddms,就可以查看系统log,很容易看到程序为什么出错,在iPhone中如何得知呢?试试Organizer吧,分析一下Device logs,也许有用.