
Debugger data model, Javascript & x64 exception handling
Introduction
The main goal of today's post is to show a bit more of what is now possible with the latest Windbg (currently branded "WinDbg Preview" in the Microsoft store) and the time travel debugging tools that Microsoft released a few months ago. When these finally got released, a bit after cppcon2017 this year, I expected a massive pick-up from the security / reverse-engineering industry with a bunch of posts, tools, scripts, etc. To my surprise, this has not happened yet so I have waited patiently for my vacation to write a little something about it myself. So, here goes!
Obviously, one of the most noticeable change in this debugger is the new UI.. but this is not something we will talk about. The second big improvement is .. a decent scripting engine! Until recently, I always had to use pyKD to write automation scripts. This has worked fairly well for years, but I’m glad to move away from it and embrace the new extension model provided by Windbg & Javascript (yes, you read this right). One of the biggest pain point I’ve to deal with with pyKD (aside from the installation process!) is that you had to evaluate many commands and then parse their outputs to extract the bits and pieces you needed. Thankfully, the new debugger data model solves this (or part of this anyway). The third new change is the integration of the time travel debugging (TTD) features discussed in this presentation: Time Travel Debugging: Root Causing Bugs in Commercial Scale Software .
The goal of this post is to leverage all the nifty stuff we will learn to enumerate x64 try/except handlers in Javascript.
So grab yourself a cup of fine coffee and read on :).
- Introduction
- The debugger data model
- Scripting the model in Javascript
- Javascript integers and Int64
- Accessing CPU registers
- Reading memory
- Executing / evaluating commands
- Setting breakpoints
- TTD
- Extend the data model
- Misc
- Try and play with host.* API from the command window
- How to load an extension script
- How to run an imperative script
- Is the Javascript engine only available in Windbg Preview?
- How to debug a script?
- How to do Nat-Vis style visualizer in Javascript?
- Get a value out of a typed object
- Evaluate expressions
- How to access global from modules
- x64 exception handling vs Javascript
- EOF
The debugger data model
Overview
What is being called the debugger data model is a hierarchy of objects (methods, properties, values) that are accessible both directly from the debugger's command window and through a Javascript API. The debugger exposes a bunch of information that it is responsible: thread related information, register values, stack trace information, etc. As an extension writer, you can go and expose your feature through the node of your choosing in the hierarchy. Once it is plugged in into the model, it is available for consumption by another script, or through the debugger's command window.
First query
Say you would like to find what modules the current @rip is pointing into, you can easily express this through a query using LINQ operators and the data model:
0:001> dx @$curprocess.Modules.Where(p => @rip >= p.BaseAddress && @rip < (p.BaseAddress+p.Size))
@$curprocess.Modules.Where(p => @rip >= p.BaseAddress && @rip < (p.BaseAddress+p.Size))
    [0x8]            : C:\WINDOWS\SYSTEM32\ntdll.dll
..and you can even check all the information related to this module by clicking on the DML [0x8] link:
0:001> dx -r1 @$curprocess.Modules.Where(p => @rip >= p.BaseAddress && @rip < (p.BaseAddress+p.Size))[8]
@$curprocess.Modules.Where(p => @rip >= p.BaseAddress && @rip < (p.BaseAddress+p.Size))[8]                 : C:\WINDOWS\SYSTEM32\ntdll.dll
    BaseAddress      : 0x7ffc985a0000
    Name             : C:\WINDOWS\SYSTEM32\ntdll.dll
    Size             : 0x1db000
In the previous two samples, there are several interesting points to highlight:
1) dx is the operator to access the data model which is not available through the ?? / ? operators
2) @$name is how you access a variable that you have defined during a debugging session. The debugger itself defines several variables right off the bat just to make querying the model easier: @$curprocess is equivalent to host.currentProcess in Javascript, @cursession is host.currentSession, and @$curthread is host.currentThread. You can also define custom variables yourself, for example:
0:001> dx @$doare = "Diary of a reverse-engineer"
@$doare = "Diary of a reverse-engineer" : Diary of a reverse-engineer
    Length           : 0x1b

0:001> dx "Hello, " + @$doare
"Hello, " + @$doare : Hello, Diary of a reverse-engineer
    Length           : 0x22

0:001> ?? @$doare
Bad register error at '@$doare'

0:001> ? @$doare
Bad register error at '@$doare'
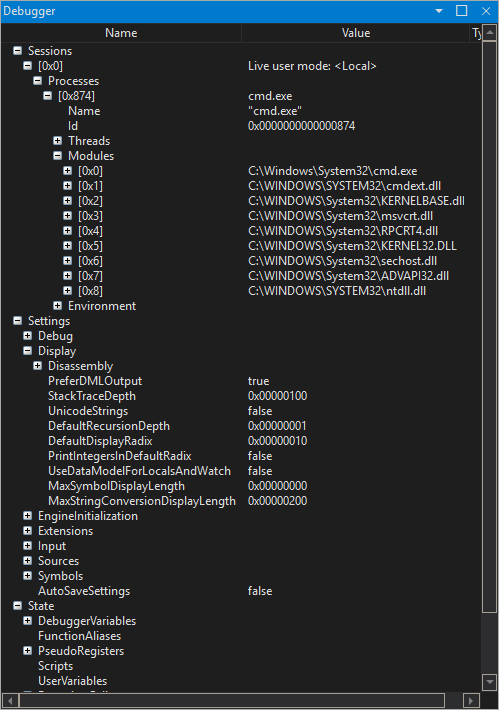
3) To query all the nodes in the @$curprocess hierarchy (if you want to wander through the data model you can just use dx Debugger and click through the DML links):
0:001> dx @$curprocess
@$curprocess                 : cmd.exe [Switch To]
    Name             : cmd.exe
    Id               : 0x874
    Threads
    Modules
    Environment
You can also check Debugger.State.DebuggerVariables where you can see the definitions for the variables we just mentioned:
0:001> dx Debugger.State.DebuggerVariables
Debugger.State.DebuggerVariables
    cursession       : Live user mode: <Local>
    curprocess       : cmd.exe [Switch To]
    curthread        : ntdll!DbgUiRemoteBreakin (00007ffc`98675320)  [Switch To]
    scripts
    scriptContents   : [object Object]
    vars
    curstack
    curframe         : ntdll!DbgBreakPoint [Switch To]

0:001> dx Debugger.State.DebuggerVariables.vars
Debugger.State.DebuggerVariables.vars
    doare            : Diary of a reverse-engineer
4) Last but not least, most of (all?) the iterable objects can be queried through LINQ-style operators. If you’ve never used these it can be a bit weird at the beginning but at some point it will click and then it is just goodness.
Here is the list of the currently available operators on iterable objects in the data model:
Aggregate        [Aggregate(AggregateMethod) | Aggregate(InitialSeed, AggregateMethod) | Aggregate(InitialSeed, AggregateMethod, ResultSelectorMethod) - LINQ equivalent method which iterates through the items in the given collection, running the aggregate method on each one and storing the returned result as the current aggregate value. Once the collection has been exhausted, the final accumulated value is returned. An optional result selector method can be specified which transforms the final accumulator value before returning it.]
All              [All(PredicateMethod) - LINQ equivalent method which returns whether all elements in the collection match a given predicate]
AllNonError      [AllNonError(PredicateMethod) - LINQ equivalent method which returns whether all elements in the collection match a given predicate. Errors are ignored if all non-error results match the predicate.]
Any              [Any(PredicateMethod) - LINQ equivalent method which returns whether any element in the collection matches a given predicate]
Average          [Average([ProjectionMethod]) - LINQ equivalent method which finds the average of all values in the enumeration. An optional projection method can be specified that transforms each value before the average is computed.]
Concat           [Concat(InnerCollection) - LINQ equivalent method which returns all elements from both collections, including duplicates.]
Contains         [Contains(Object, [ComparatorMethod]) - LINQ equivalent method which searches for the given element in the sequence using default comparator rules. An optional comparator method can be provided that will be called each time the element is compared against an entry in the sequence.]
Count            [Count() - LINQ equivalent method which returns the number of objects in the collection]
Distinct         [Distinct([ComparatorMethod]) - LINQ equivalent method which returns all distinct objects from the given collection, using default comparison rules. An optional comparator method can be provided to be called each time objects in the collection must be compared.]
Except           [Except(InnerCollection, [ComparatorMethod]) - LINQ equivalent method which returns all distinct objects in the given collection that are NOT found in the inner collection. An optional comparator method can also be specified.]
First            [First([PredicateMethod]) - LINQ equivalent method which returns the first element in the collection or the first which matches an optional predicate]
FirstNonError    [FirstNonError([PredicateMethod]) - LINQ equivalent method which returns the first element in the collection or the first which matches an optional predicate. Any errors encountered are ignored if a valid element is found.]
Flatten          [Flatten([KeyProjectorMethod]) - Method which flattens a tree of collections (or a tree of keys that project to collections via an optional projector method) into a single collection]
GroupBy          [GroupBy(KeyProjectorMethod, [KeyComparatorMethod]) - LINQ equivalent method which groups the collection by unique keys defined via a key projector and optional key comparator]
Intersect        [Intersect(InnerCollection, [ComparatorMethod]) - LINQ equivalent method which returns all distinct objects in the given collection that are also found in the inner collection. An optional comparator method can also be specified.]
Join             [Join(InnerCollection, Outer key selector method, Inner key selector method, Result selector method, [ComparatorMethod]) - LINQ equivalent method which projects a key for each element of the outer collection and each element of the inner collection using the methods provided. If the projected keys from both these elements match, then the result selector method is called with both those values and its output is returned to the user. An optional comparator method can also be specified.]
Last             [Last([PredicateMethod]) - LINQ equivalent method which returns the last element in the collection or the last which matches an optional predicate]
LastNonError     [LastNonError([PredicateMethod]) - LINQ equivalent method which returns the last element in the collection or the last which matches an optional predicate. Any errors are ignored.]
Max              [Max([ProjectionMethod]) - LINQ equivalent method which returns the maximum element using standard comparison rules. An optional projection method can be specified to project the elements of a sequence before comparing them with each other.]
Min              [Min([ProjectionMethod]) - LINQ equivalent method which returns the minimum element using standard comparison rules. An optional projection method can be specified to project the elements of a sequence before comparing them with each other.]
OrderBy          [OrderBy(KeyProjectorMethod, [KeyComparatorMethod]) - LINQ equivalent method which orders the collection via a key projector and optional key comparator in ascending order]
OrderByDescending [OrderByDescending(KeyProjectorMethod, [KeyComparatorMethod]) - LINQ equivalent method which orders the collection via a key projector and optional key comparator in descending order]
Reverse          [Reverse() - LINQ equivalent method which returns the reverse of the supplied enumeration.]
Select           [Select(ProjectionMethod) - LINQ equivalent method which projects the collection to a new collection via calling a projection method on every element]
SequenceEqual    [SequenceEqual(InnerCollection, [ComparatorMethod]) - LINQ equivalent method which goes through the outer and inner collections and makes sure that they are equal (incl. sequence length). An optional comparator can be specified.]
Single           [Single([PredicateMethod]) - LINQ equivalent method which returns the only element in a list, or, if a predicate was specified, the only element that satisfies the predicate. If there are multiple elements that match the criteria, an error is returned.]
Skip             [Skip(Count) - LINQ equivalent method which skips the specified number of elements in the collection and returns all the rest.]
SkipWhile        [SkipWhile(PredicateMethod) - LINQ equivalent method which runs the predicate for each element and skips it as long as it keeps returning true. Once the predicate fails, the rest of the collection is returned.]
Sum              [Sum([ProjectionMethod]) - LINQ equivalent method which sums all the elements in the collection. Can optionally specify a projector method to transform the elements before summation occurs.]
Take             [Take(Count) - LINQ equivalent method which takes the specified number of elements from the collection.]
TakeWhile        [TakeWhile(PredicateMethod) - LINQ equivalent method which runs the predicate for each element and returns it only if the result is successful. Once the predicate fails, no more elements will be taken.]
Union            [Union(InnerCollection, [ComparatorMethod]) - LINQ equivalent method which returns all distinct objects from the given and inner collection. An optional comparator method can also be specified.]
Where            [Where(FilterMethod) - LINQ equivalent method which filters elements in the collection according to when a filter method returns true for a given element]
Now you may be wondering if the model is available with every possible configuration of Windbg? By configuration I mean that you can use the debugger live in user-mode attached to a process, offline looking at a crash-dump of a process, live in kernel-mode, offline looking at a system crash-dump, or off-line looking at a TTD trace.
And yes, the model is accessible with all the previous configurations, and this is awesome. This allows you to, overall, write very generic scripts as long as the information you are mining / exposing is not tied to a specific configuration.
Scripting the model in Javascript
As we described a bit earlier, you can now access programmatically everything that is exposed through the model via Javascript. No more eval or string parsing to extract the information you want, just go find the node exposing what you are after. If this node doesn’t exist, add your own to expose the information you want :)
Javascript integers and Int64
The first thing you need to be aware with Javascript is the fact that integers are encoded in C doubles.. which means your integers are stored in 53 bits. This is definitely a problem as most of the data we deal with are 64 bit integers. In order to address this problem, Windbg exposes a native type to Javascript that is able to store 64 bit integers. The type is called Int64 and most (all?) information available in the data model is through Int64 instances. This type exposes various methods to perform arithmetic and binary operations (if you use the native operators, the Int64 gets converted back to an integer and throws if data is lost during this conversion; cf Auto-conversion). It takes a bit of time to get used to this, but feels natural pretty quickly. Note that the Frida framework exposes a very similar type to address the same issue, which means it will be even easier for you if you have played with Frida in the past!
You can construct an Int64 directly using a native Javascript integers (so at most 53 bits long as described above), or you can use the host.parseInt64 method that takes a string as input. The other very important method you are going to need is Int64.compareTo which returns 1 if the instance is bigger than the argument, 0 if equal and -1 if smaller. The below script shows a summary of the points we touched on:
// Int64.js
"use strict";

let logln = function (e) {
    host.diagnostics.debugLog(e + '\n');
}

function invokeScript() {
    let a = host.Int64(1337);
    let aplusone = a + 1;
    // 53a
    logln(aplusone.toString(16));
    let b = host.parseInt64('0xdeadbeefbaadc0de', 16);
    let bplusone = b.add(1);
    // 0xdeadbeefbaadc0df
    logln(bplusone.toString(16));
    let bplusonenothrow = b.convertToNumber() + 1;
    // 16045690984229355000
    logln(bplusonenothrow);
    try {
        let bplusonethrow = b + 1;
    } catch(e) {
        // Error: 64 bit value loses precision on conversion to number
        logln(e);
    }
    // 1
    logln(a.compareTo(1));
    // 0
    logln(a.compareTo(1337));
    // -1
    logln(a.compareTo(1338));
}
For more information I would recommend looking at this page JavaScript Debugger Scripting.
Accessing CPU registers
Registers are accessible in the host.currentThread.Registers object. You can access the classical GPRs in the User node, but you can also access the xmm/ymm registers via SIMD and Floating Point nodes. As you may have guessed, the registers are all instances of the Int64 object we just talked about.
Reading memory
You can read raw memory via the host.memory.readMemoryValues function. It allows you to read memory as an array of items whose size you can specify. You can also use host.memory.readString and host.memory.readWideString for reading (narrow/wide) strings directly from memory.
//readmemory.js
"use strict";

let logln = function (e) {
    host.diagnostics.debugLog(e + '\n');
}

function read_u64(addr) {
    return host.memory.readMemoryValues(addr, 1, 8)[0];
}

function invokeScript() {
    let Regs = host.currentThread.Registers.User;
    let a = read_u64(Regs.rsp);
    logln(a.toString(16));
    let WideStr = host.currentProcess.Environment.EnvironmentBlock.ProcessParameters.ImagePathName.Buffer;
    logln(host.memory.readWideString(WideStr));
    let WideStrAddress = WideStr.address;
    logln(host.memory.readWideString(WideStrAddress));
}
Executing / evaluating commands
Even though a bunch of data is accessible programmatically via the data model, not everything is exposed today in the model. For example, you cannot access the same amount of information that kp shows you with the Frame model object. Specifically, the addresses of the frames or the saved return addresses are not currently available in the object unfortunately :-( As a result, being able to evaluate commands can still be important.
The API call ExecuteCommand evaluates a command and returns the output of the command as a string:
//eval.js
"use strict";

let logln = function (e) {
    host.diagnostics.debugLog(e + '\n');
}

function invokeScript() {
    let Control = host.namespace.Debugger.Utility.Control;
    for(let Line of Control.ExecuteCommand('kp')) {
        logln('Line: ' + Line);
    }
}
There is at least one pitfall with this function to be aware of: the API executes until it completes. So, if you use ExecuteCommand to execute let's say gc the call will return only when you encounter any sort of break. If you don't encounter any break, the call will never end.
Setting breakpoints
Settings breakpoints is basically handled by three different APIs: SetBreakpointAtSourceLocation, SetBreakpointAtOffset, and SetBreakpointForReadWrite. The names are pretty self-explanatory so I will not spend much time describing them. Unfortunately, as far as I can tell there is no easy way to bind a breakpoint to a Javascript function that could handle it when it is hit. The objects returned by these APIs have a Command field you can use to trigger a command when the breakpoint fires, as opposed to a function invocation. In essence, it is pretty much the same than when you do bp foo "command".
Hopefully these APIs will become more powerful and more suited for scripting in future versions with the possibility of invoking a Javascript function when triggered, that would pass an object to the function describing why and where the breakpoint triggered, etc.
Here is a simple example:
//breakpoint.js
"use strict";

let logln = function (e) {
    host.diagnostics.debugLog(e + '\n');
}

function handle_bp() {
    let Regs = host.currentThread.Registers.User;
    let Args = [ Regs.rcx, Regs.rdx, Regs.r8 ];
    let ArgsS = Args.map(c => c.toString(16));
    let HeapHandle = ArgsS[0];
    let Flags = ArgsS[1];
    let Size = ArgsS[2];
    logln('RtlAllocateHeap: HeapHandle: ' + HeapHandle + ', Flags: ' + Flags + ', Size: ' + Size);
}

function invokeScript() {
    let Control = host.namespace.Debugger.Utility.Control;
    let Regs = host.currentThread.Registers.User;
    let CurrentProcess = host.currentProcess;
    let BreakpointAlreadySet = CurrentProcess.Debug.Breakpoints.Any(
        c => c.OffsetExpression == 'ntdll!RtlAllocateHeap+0x0'
    );

    if(BreakpointAlreadySet == false) {
        let Bp = Control.SetBreakpointAtOffset('RtlAllocateHeap', 0, 'ntdll');
        Bp.Command = '.echo doare; dx @$scriptContents.handle_bp(); gc';
    } else {
        logln('Breakpoint already set.');
    }
    logln('Press "g" to run the target.');
    // let Lines = Control.ExecuteCommand('gc');
    // for(let Line of Lines) {
    //     logln('Line: ' + Line);
    // }
}
This gives:
0:000>
Press "g" to run the target.
0:000> g-
doare
RtlAllocateHeap: HeapHandle: 0x21b5dcd0000, Flags: 0x140000, Size: 0x82
@$scriptContents.handle_bp()
doare
RtlAllocateHeap: HeapHandle: 0x21b5dcd0000, Flags: 0x140000, Size: 0x9a
@$scriptContents.handle_bp()
doare
RtlAllocateHeap: HeapHandle: 0x21b5dcd0000, Flags: 0x140000, Size: 0x40
@$scriptContents.handle_bp()
doare
RtlAllocateHeap: HeapHandle: 0x21b5dcd0000, Flags: 0x140000, Size: 0x38
@$scriptContents.handle_bp()
doare
RtlAllocateHeap: HeapHandle: 0x21b5dcd0000, Flags: 0x0, Size: 0x48
@$scriptContents.handle_bp()
...
Now, I find this interface not well suited for scenarios where you need to have a breakpoint that just dumps stuff and keep going, but hopefully in the future this will improve. Let's say you have a function and you’re interested in dumping its arguments/state every time it gets called. If you attempt to do this with the above code, every time the breakpoint is hit the debugger will execute your callback and stop. At this point you have to tell it to keep executing. (Also, feel free to uncomment the last lines of the script to see what happens if you ExecuteCommand('gc') :-)).
One way I found around this limitation is to use evaluation and the bp command:
//breakpoint2.js
"use strict";

let logln = function (e) {
    host.diagnostics.debugLog(e + '\n');
}

function handle_bp() {
    let Regs = host.currentThread.Registers.User;
    let Args = [Regs.rcx, Regs.rdx, Regs.r8];
    let ArgsS = Args.map(c => c.toString(16));
    let HeapHandle = ArgsS[0];
    let Flags = ArgsS[1];
    let Size = ArgsS[2];
    logln('RtlAllocateHeap: HeapHandle: ' + HeapHandle + ', Flags: ' + Flags + ', Size: ' + Size);
    if(Args[2].compareTo(0x100) > 0) {
        // stop execution if the allocation size is bigger than 0x100
        return true;
    }
    // keep the execution going if it's a small size
    return false;
}

function invokeScript() {
    let Control = host.namespace.Debugger.Utility.Control;
    let Regs = host.currentThread.Registers.User;
    let CurrentProcess = host.currentProcess;
    let HeapAlloc = host.getModuleSymbolAddress('ntdll', 'RtlAllocateHeap');
    let BreakpointAlreadySet = CurrentProcess.Debug.Breakpoints.Any(
        c => c.Address == HeapAlloc
    );
    if(BreakpointAlreadySet == false) {
        logln('RltAllocateHeap @ ' + HeapAlloc.toString(16));
        Control.ExecuteCommand('bp /w "@$scriptContents.handle_bp()" ' + HeapAlloc.toString(16));
    } else {
        logln('Breakpoint already set.');
    }
    logln('Press "g" to run the target.');
}
Which gives this output:
0:000>
RltAllocateHeap @ 0x7fffc07587a0
Press "g" to run the target.
0:000> g
RtlAllocateHeap: HeapHandle: 0x21b5dcd0000, Flags: 0x0, Size: 0x48
RtlAllocateHeap: HeapHandle: 0x21b5dcd0000, Flags: 0x140000, Size: 0x38
...
RtlAllocateHeap: HeapHandle: 0x21b5dcd0000, Flags: 0x140000, Size: 0x34a
Breakpoint 0 hit
Time Travel Position: 2A51:314
ntdll!RtlAllocateHeap:
00007fff`c07587a0 48895c2408      mov     qword ptr [rsp+8],rbx ss:000000b8`7f39e9a0=000000b87f39e9b0
Of course, yet another way of approaching this problem would be to wrap the script invocation into the command of a breakpoint like this:
bp ntdll!RtlAllocateHeap ".scriptrun c:\foo\script.js"
TTD
For those who are not familiar with Microsoft’s "Time Travel Debugging" toolset, in a nutshell it allows you to record the execution of a process. Once the recording is done, you end up with a trace file written to disk that you can load into the debugger to replay what you just recorded -- a bit like a camera / VCR. If you want to learn more about it, I would highly recommend checking out this presentation: Time Travel Debugging: root causing bugs in commercial scale software.
Even though I won’t cover how recording and replaying a TTD trace in this article, I just wanted to show you in this part how powerful such features can be once coupled with the data model. As you have probably realized by now, the data model is all about extensibility: you can access specific TTD features via the model when you have a trace loaded in the debugger. This section tries to describe them.
TTD.Calls
The first feature I wanted to talked about is TTD.Calls. This API goes through an entire execution trace and finds every unique point in the trace where an API has been called.
0:000> dx -v @$cursession.TTD
@$cursession.TTD                 : [object Object]
    Calls            [Returns call information from the trace for the specified set of symbols: TTD.Calls("module!symbol1", "module!symbol2", ...)]
For each of those points, you have an object describing the call: time travel position (that you can travel to: see TimeStart and TimeEnd below), parameters (leveraging symbols if you have any to know how many parameters the API expects), return value, the thread id, etc.
Here is what it looks like:
0:000> dx -r1 @$cursession.TTD.Calls("ntdll!RtlAllocateHeap").Count()
@$cursession.TTD.Calls("ntdll!RtlAllocateHeap").Count() : 0x267

0:000> dx @$cursession.TTD.Calls("ntdll!RtlAllocateHeap").First()
@$cursession.TTD.Calls("ntdll!RtlAllocateHeap").First()
    EventType        : Call
    ThreadId         : 0x1004
    UniqueThreadId   : 0x6
    TimeStart        : 12C1:265 [Time Travel]
    TimeEnd          : 12DE:DC [Time Travel]
    Function         : ntdll!RtlAllocateHeap
    FunctionAddress  : 0x7fffc07587a0
    ReturnAddress    : 0x7fffbdcd9cc1
    ReturnValue      : 0x21b5df71980
    Parameters

0:000> dx -r1 @$cursession.TTD.Calls("ntdll!RtlAllocateHeap").First().Parameters
@$cursession.TTD.Calls("ntdll!RtlAllocateHeap").First().Parameters
    [0x0]            : 0x21b5df70000
    [0x1]            : 0x8
    [0x2]            : 0x2d8
    [0x3]            : 0x57
Obviously, the collection returned by TTD.Calls can be queried via the same LINQ-like operators we mentioned earlier which is awesome. As an example, asking the following question has never been easier: "How many times did the allocator fail to allocate memory?":
0:000> dx @$Calls=@$cursession.TTD.Calls("ntdll!RtlAllocateHeap").Where(c => c.ReturnValue == 0)
@$Calls=@$cursession.TTD.Calls("ntdll!RtlAllocateHeap").Where(c => c.ReturnValue == 0)

0:000> dx @$Calls.Count()
@$Calls.Count()  : 0x0
Note that because the API has been designed in a way that abstracts away ABI-specific details, you can have your query / code working on both x86 & x64 seamlessly. Another important point is that this is much faster than setting a breakpoint manually and running the trace forward to collect this information yourself.
TTD.Memory
The other very powerful feature that was announced fairly recently in version 1.1712.15003 is TTD.Memory. A bit like TTD.Calls, this feature lets you go and find every memory accesses that happened in an execution trace on a specific memory range. And again, it returns to the user a nice object that has all the information you could be potentially interested in (time travel positions, access type, the instruction pointer address, the address of the memory accessed, etc.):
0:000> dx @$Accesses[0]
@$Accesses[0]
    EventType        : MemoryAccess
    ThreadId         : 0x15e8
    UniqueThreadId   : 0x3
    TimeStart        : F44:2 [Time Travel]
    TimeEnd          : F44:2 [Time Travel]
    AccessType       : Write
    IP               : 0x7fffc07649bf
    Address          : 0xb87f67fa70
    Size             : 0x4
    Value            : 0x0
Here is how you would go and ask it to find out every piece of code that write-accessed (read and execute are also other valid type of access you can query for and combine) the TEB region of the current thread:
0:001> ? @$teb
Evaluate expression: 792409825280 = 000000b8`7f4e6000

0:001> ?? sizeof(_TEB)
unsigned int64 0x1838

0:001> dx @$Accesses=@$cursession.TTD.Memory(0x000000b8`7f4e6000, 0x000000b8`7f4e6000+0x1838, "w")
@$Accesses=@$cursession.TTD.Memory(0x000000b8`7f4e6000, 0x000000b8`7f4e6000+0x1838, "w")

0:001> dx @$Accesses[0]
@$Accesses[0]
    EventType        : MemoryAccess
    ThreadId         : 0x15e8
    UniqueThreadId   : 0x3
    TimeStart        : F79:1B [Time Travel]
    TimeEnd          : F79:1B [Time Travel]
    AccessType       : Write
    IP               : 0x7fffc0761bd0
    Address          : 0xb87f4e7710
    Size             : 0x10
    Value            : 0x0
The other beauty of it is that you can travel to the position ID and find out what happened:
0:001> !tt F79:1B
Setting position: F79:1B
(1cfc.15e8): Break instruction exception - code 80000003 (first/second chance not available)
Time Travel Position: F79:1B
ntdll!TppWorkCallbackPrologRelease+0x100:
00007fff`c0761bd0 f30f7f8010170000 movdqu  xmmword ptr [rax+1710h],xmm0 ds:000000b8`7f4e7710=00000000000000000000000000000000

0:001> dt _TEB ActivityId
ntdll!_TEB
    +0x1710 ActivityId : _GUID
In the above example, you can see that the TppWorkCallbackPrologRelease function is zeroing the ActivityId GUID of the current TEB - magical.
TTD.Utility.GetHeapAddress
The two previous features were mostly building blocks; this utility consumes the TTD.Calls API in order to show the lifetime of a heap chunk in a trace session. What does that mean exactly? Well, the utility looks for every heap related operation that happened on a chunk (start address, size) and show them to you.
This is extremely useful when debugging or root-causing issues, and here is what it looks like on a dummy trace:
0:000> dx -g @$cursession.TTD.Utility.GetHeapAddress(0x21b5dce40a0)
========================================================================================================================================
=                           = Action   = Heap             = Address          = Size    = Flags  = (+) TimeStart = (+) TimeEnd = Result =
========================================================================================================================================
= [0x59] : [object Object]  - Alloc    - 0x21b5dcd0000    - 0x21b5dce4030    - 0xaa    - 0x8    - ED:7D7        - EF:7D       -        =
= [0x6b] : [object Object]  - Alloc    - 0x21b5dcd0000    - 0x21b5dce40a0    - 0xaa    - 0x8    - 105:D9        - 107:7D      -        =
= [0x6c] : [object Object]  - Free     - 0x21b5dcd0000    - 0x21b5dce40a0    -         - 0x0    - 107:8D        - 109:1D      - 0x1    =
= [0x276] : [object Object] - Alloc    - 0x21b5dcd0000    - 0x21b5dce4030    - 0x98    - 0x0    - E59:3A7       - E5A:8E      -        =
========================================================================================================================================
The attentive reader has probably noticed something maybe unexpected with entries 0x59 and entries 0x276 where we are seeing two different allocations of the same chunk without any free in between. The answer to this question lies in the way the GetHeapAddress function is implemented (check out the TTD\Analyzers\HeapAnalysis.js file) - it basically looks for every heap related operation and only shows you the ones where address + size is a range containing the argument you passed. In this example we gave the function the address 0x21b5dce40a0, 0x59 is an allocation and 0x21b5dce40a0 is in the range 0x21b5dce4030 + 0xAA so we display it. Now, a free does not know the size of the chunk, the only thing it knows is the base pointer. In this case if we have a free of 0x21b5dce4030 the utility function would just not display it to us which explains how we can have two heap chunks allocated without a free in the following time frame: ED:7D7, E59:3A7.
We can even go ahead and prove this by finding the free by running the below command:
0:000> dx -g @$cursession.TTD.Utility.GetHeapAddress(0x21b5dce4030).Where(p => p.Address == 0x21b5dce4030)
========================================================================================================================================
=                           = Action   = Heap             = Address          = Size    = Flags  = (+) TimeStart = (+) TimeEnd = Result =
========================================================================================================================================
= [0x61] : [object Object]  - Alloc    - 0x21b5dcd0000    - 0x21b5dce4030    - 0xaa    - 0x8    - ED:7D7        - EF:7D       -        =
= [0x64] : [object Object]  - Free     - 0x21b5dcd0000    - 0x21b5dce4030    -         - 0x0    - EF:247        - F1:1D       - 0x1    =
= [0x276] : [object Object] - Alloc    - 0x21b5dcd0000    - 0x21b5dce4030    - 0x98    - 0x0    - E59:3A7       - E5A:8E      -        =
========================================================================================================================================
As expected, the entry 0x64 is our free operation and it also happens in between the two allocation operations we were seeing earlier - solved.
Pretty neat uh?
It is nice enough to ask the utility for a specific heap address, but it would also be super nice if we had access to the whole heap activity that has happened during the session and that is what TTD.Data.Heap gives you:
0:000> dx @$HeapOps=@$cursession.TTD.Data.Heap()
...

0:000> dx @$HeapOps.Count()
@$HeapOps.Count() : 0x414

0:000> dx @$HeapOps[137]
@$HeapOps[137]                 : [object Object]
    Action           : Free
    Heap             : 0x21b5dcd0000
    Address          : 0x21b5dcee790
    Flags            : 0x0
    Result           : 0x1
    TimeStart        : 13A1:184 [Time Travel]
    TimeEnd          : 13A2:27 [Time Travel]
And of course do not forget that all these collections are queryable. We can easily find out what are all the other heap operations that are not alloc or free with the below query:
0:000> dx @$NoFreeAlloc=@$HeapOps.Where(c => c.Action != "Free" && c.Action != "Alloc")
...

0:000> dx -g @$NoFreeAlloc
============================================================================================================
=                           = Action    = Heap             = Result          = (+) TimeStart = (+) TimeEnd =
============================================================================================================
= [0x382] : [object Object] - Lock      - 0x21b5dcd0000    - 0xb87f4e3001    - 1ADE:602      - 1ADF:14     =
= [0x386] : [object Object] - Unlock    - 0x21b5dcd0000    - 0xb87f4e3001    - 1AE0:64       - 1AE1:13     =
= [0x38d] : [object Object] - Lock      - 0x21b5dcd0000    - 0xb87f4e3001    - 1B38:661      - 1B39:14     =
= [0x391] : [object Object] - Unlock    - 0x21b5dcd0000    - 0xb87f4e3001    - 1B3A:64       - 1B3B:13     =
= [0x397] : [object Object] - Lock      - 0x21b5dcd0000    - 0xb87f4e3001    - 1BF0:5F4      - 1BF1:14     =
= [0x399] : [object Object] - Unlock    - 0x21b5dcd0000    - 0xb87f4e3001    - 1BF1:335      - 1C1E:13     =
...
Extend the data model
After consuming all the various features available in the data model, I am sure you guys are wondering how you can go and add your own node and extend it. In order to do this, you can use the API host.namedModelParent.
class host.namedModelParent

An object representing a modification of the object model of the debugger.
This links together a JavaScript class (or prototype) with a data model.
The JavaScript class (or prototype) becomes a parent data model (e.g.: similar to a prototype)
to the data model registered under the supplied name.

An instance of this object can be returned in the array of records returned from
the initializeScript method.
Let's say we would like to add a node that is associated with a Process called DiaryOfAReverseEngineer which has the following properties:
- DiaryOfAReverseEngineer
- Foo - string
- Bar - string
- Add - function
- Sub
- SubBar - string
- SubFoo - string
Step 1: Attach a node to the Process model
Using host.namedModelParent you get the opportunity to link a Javascript class to the model of your choice. The other thing to understand is that this feature is made to be used by extension (as opposed to imperative) scripts.
Extension and imperative scripts are basically the same but they have different entry points: extensions use initializeScript (the command .scriptload invokes this entry point) and imperative scripts use invokeScript (the command .scriptrun invokes both the initializeScript and invokeScript). The small difference is that in an extension script you are expected to return an array of registration objects if you want to modify the data model, which is exactly what we want to do.
Anyway, let's attach a node called DiaryOfAReverseEngineer to the Process model:
//extendmodel_1.js
"use strict";

class ProcessModelParent {
    get DiaryOfAReverseEngineer() {
        return 'hello from ' + this.Name;
    }
}

function initializeScript() {
    return [new host.namedModelParent(
        ProcessModelParent,
        'Debugger.Models.Process'
    )];
}
Once loaded you can go ahead and check that the node has been added:
0:000> dx @$curprocess
@$curprocess                 : PING.EXE [Switch To]
    Name             : PING.EXE
    Id               : 0x1cfc
    Threads
    Modules
    Environment
    TTD
    DiaryOfAReverseEngineer : hello from PING.EXE
One important thing to be aware of in the previous example is that the this pointer is effectively an instance of the data model you attached to. In our case it is an instance of the Process model and as a result you can access every property available on this node, like its Name for example.
Step 2: Add the first level to the node
What we want to do now is to have our top node exposing two string properties and one function (we’ll deal with Sub later). This is done by creating a new Javascript class that represents this level, and we can return an instance of this said class in the DiaryOfReverseEngineer property. Simple enough uh?
//extendmodel_2.js
"use strict";

class DiaryOfAReverseEngineer {
    constructor(Process) {
        this.process = Process;
    }

    get Foo() {
        return 'Foo from ' + this.process.Name;
    }

    get Bar() {
        return 'Bar from ' + this.process.Name;
    }

    Add(a, b) {
        return a + b;
    }
}

class ProcessModelParent {
    get DiaryOfAReverseEngineer() {
        return new DiaryOfAReverseEngineer(this);
    }
}

function initializeScript() {
    return [new host.namedModelParent(
        ProcessModelParent,
        'Debugger.Models.Process'
    )];
}
Which gives:
0:000> dx @$curprocess
@$curprocess                 : PING.EXE [Switch To]
    Name             : PING.EXE
    Id               : 0x1cfc
    Threads
    Modules
    Environment
    TTD
    DiaryOfAReverseEngineer : [object Object]

0:000> dx @$curprocess.DiaryOfAReverseEngineer
@$curprocess.DiaryOfAReverseEngineer                 : [object Object]
    process          : PING.EXE [Switch To]
    Foo              : Foo from PING.EXE
    Bar              : Bar from PING.EXE
From the previous dumps there are at least two things we can do better:
1) The DiaryOfAReverseEngineer node has a string representation of [object Object] which is not great. In order to fix that we can just define our own toString method and return what we want.
2) When displaying the DiaryOfAReverseEngineer node, it displays the instance properties process where we keep a copy of the Process model we attached to. Now, this might be something you want to hide to the user as it has nothing to do with whatever this node is supposed to be about. To solve that, we just have to prefix the field with __.
(If you are wondering why we do not see the method Add you can force dx to display it with the -v flag.)
After fixing the two above points, here is what we have:
// extendmodel_2_1.js
"use strict";

class DiaryOfAReverseEngineer {
    constructor(Process) {
        this.__process = process;
    }

    get Foo() {
        return 'Foo from ' + this.__process.Name;
    }

    get Bar() {
        return 'Bar from ' + this.__process.Name;
    }

    Add(a, b) {
        return a + b;
    }

    toString() {
        return 'Diary of a reverse-engineer';
    }
}

class ProcessModelParent {
    get DiaryOfAReverseEngineer() {
        return new DiaryOfAReverseEngineer(this);
    }
}

function initializeScript() {
    return [new host.namedModelParent(
        ProcessModelParent,
        'Debugger.Models.Process'
    )];
}
And now if we display the Process model:
0:000> dx @$curprocess
@$curprocess                 : PING.EXE [Switch To]
    Name             : PING.EXE
    Id               : 0x1cfc
    Threads
    Modules
    Environment
    TTD
    DiaryOfAReverseEngineer : Diary of a reverse-engineer

0:000> dx @$curprocess.DiaryOfAReverseEngineer
@$curprocess.DiaryOfAReverseEngineer                 : Diary of a reverse-engineer
    Foo              : Foo from PING.EXE
    Bar              : Bar from PING.EXE

0:000> dx @$curprocess.DiaryOfAReverseEngineer.Add(1, 2)
@$curprocess.DiaryOfAReverseEngineer.Add(1, 2) : 0x3
Step 3: Adding another level and an iterable class
At this stage, I am pretty sure that you guys are starting to get the hang of it. In order to add a new level, you can just define yet another class, define a property in the DiaryOfAReverseEngineer class and return an instance of it. And that's basically it.
The last concept I wanted to touch on before moving on is how to add the iterable property on one of your data model classes. Let's say you have a class called Attribute that stores a key and a value, and let's also say you have another class called Attributes that is an Attribute store. The thing is, you might have noticed that one class instance usually corresponds to a node with its own properties in the data model view. This is not great for our Attributes class as it is basically an array of Attribute objects, meaning that we will have two copies of everything..
If you want to have the debugger be able to iterate on your instance you can define a *[Symbol.iterator]() method like this:
// Attributes iterable
class Attribute {
    constructor(Process, Name, Value) {
        this.__process = Process;
        this.Name = Name;
        this.Value = Value;
    }

    toString() {
        let S = 'Process: ' + this.__process.Name + ', ';
        S += 'Name: ' + this.Name + ', ';
        S += 'Value: ' + this.Value;
        return S;
    }
}

class Attributes {
    constructor() {
        this.__attrs = [];
    }

    push(Attr) {
        this.__attrs.push(Attr);
    }

    *[Symbol.iterator]() {
        for (let Attr of this.__attrs) {
            yield Attr;
        }
    }

    toString() {
        return 'Attributes';
    }
}
Now if we put it all together we have:
// extendmodel.js
"use strict";

class Attribute {
    constructor(Process, Name, Value) {
        this.__process = Process;
        this.Name = Name;
        this.Value = Value;
    }

    toString() {
        let S = 'Process: ' + this.__process.Name + ', ';
        S += 'Name: ' + this.Name + ', ';
        S += 'Value: ' + this.Value;
        return S;
    }
}

class Attributes {
    constructor() {
        this.__attrs = [];
    }

    push(Attr) {
        this.__attrs.push(Attr);
    }

    *[Symbol.iterator]() {
        for (let Attr of this.__attrs) {
            yield Attr;
        }
    }

    toString() {
        return 'Attributes';
    }
}

class Sub {
    constructor(Process) {
        this.__process = Process;
    }

    get SubFoo() {
        return 'SubFoo from ' + this.__process.Name;
    }

    get SubBar() {
        return 'SubBar from ' + this.__process.Name;
    }

    get Attributes() {
        let Attrs = new Attributes();
        Attrs.push(new Attribute(this.__process, 'attr0', 'value0'));
        Attrs.push(new Attribute(this.__process, 'attr1', 'value0'));
        return Attrs;
    }

    toString() {
        return 'Sub module';
    }
}

class DiaryOfAReverseEngineer {
    constructor(Process) {
        this.__process = Process;
    }

    get Foo() {
        return 'Foo from ' + this.__process.Name;
    }

    get Bar() {
        return 'Bar from ' + this.__process.Name;
    }

    Add(a, b) {
        return a + b;
    }

    get Sub() {
        return new Sub(this.__process);
    }

    toString() {
        return 'Diary of a reverse-engineer';
    }
}

class ProcessModelParent {
    get DiaryOfAReverseEngineer() {
        return new DiaryOfAReverseEngineer(this);
    }
}

function initializeScript() {
    return [new host.namedModelParent(
        ProcessModelParent,
        'Debugger.Models.Process'
    )];
}
And we can play with the node in the model:
0:000> dx @$curprocess
@$curprocess                 : PING.EXE [Switch To]
    Name             : PING.EXE
    Id               : 0x1cfc
    Threads
    Modules
    Environment
    TTD
    DiaryOfAReverseEngineer : Diary of a reverse-engineer

0:000> dx @$curprocess.DiaryOfAReverseEngineer
@$curprocess.DiaryOfAReverseEngineer                 : Diary of a reverse-engineer
    Foo              : Foo from PING.EXE
    Bar              : Bar from PING.EXE
    Sub              : Sub module

0:000> dx @$curprocess.DiaryOfAReverseEngineer.Sub
@$curprocess.DiaryOfAReverseEngineer.Sub                 : Sub module
    SubFoo           : SubFoo from PING.EXE
    SubBar           : SubBar from PING.EXE
    Attributes       : Attributes

0:000> dx @$curprocess.DiaryOfAReverseEngineer.Sub.Attributes
@$curprocess.DiaryOfAReverseEngineer.Sub.Attributes                 : Attributes
    [0x0]            : Process: PING.EXE, Name: attr0, Value: value0
    [0x1]            : Process: PING.EXE, Name: attr1, Value: value0

0:000> dx @$curprocess.DiaryOfAReverseEngineer.Sub.Attributes[0]
@$curprocess.DiaryOfAReverseEngineer.Sub.Attributes[0]                 : Process: PING.EXE, Name: attr0, Value: value0
    Name             : attr0
    Value            : value0
Another simpler example is available in Determining process architecture with JavaScript and LINQ where the author adds a node to the Process node that tells you with which bitness the process is running on, either 64 or 32 bits.
If you want to extend the data model with best practices you should also have a look at Debugger Data Model Design Considerations which sort of lays down various guidelines.
Misc
In this section I will try to answer a bunch of other questions and share various tricks that have been useful for me - you might learn a thing or two!
Try and play with host.* API from the command window
One of the things I quickly was bothered with at first is not being able to run my Javascript from the command window. Let's say that you want to play with a host.* API: these are not really directly accessible.
A way to work around that is to load a script and to use the @$scriptContents variable from where you can access the host object.
0:000> dx -v @$scriptContents.host
@$scriptContents.host                 : [object Object]
    currentApiVersionSupported : [object Object]
    currentApiVersionInitialized : [object Object]
    diagnostics      : [object Object]
    metadata         : [object Object]
    typeSignatureRegistration
    typeSignatureExtension
    namedModelRegistration
    namedModelParent
    functionAlias
    namespacePropertyParent
    optionalRecord
    apiVersionSupport
    Int64
    parseInt64
    namespace
    evaluateExpression
    evaluateExpressionInContext
    getModuleSymbol
    getModuleSymbolAddress
    setModuleSymbol
    getModuleType
    createPointerObject
    createTypedObject
    indexedValue
    getNamedModel
    registerNamedModel
    unregisterNamedModel
    registerPrototypeForTypeSignature
    registerExtensionForTypeSignature
    unregisterPrototypeForTypeSignature
    unregisterExtensionForTypeSignature
    currentSession   : Time Travel Debugging Mode
    currentProcess   : PING.EXE [Switch To]
    currentThread    [Switch To]
    memory           : [object Object]
    typeSystem       : [object Object]
    ToDisplayString  [ToDisplayString([FormatSpecifier]) - Method which converts the object to its display string representation according to an optional format specifier]
Note that this is also super useful if you want to wander around and get a feel for the various features / APIs that have not been documented yet (or you were just not aware of).
How to load an extension script
The .scriptload command is available in both Windbg Preview and the Windbg from the SDK.
How to run an imperative script
Similar to above, you can use the .scriptrun command for that.
Is the Javascript engine only available in Windbg Preview?
Nope it is not! You can load your Javascript scripts from the latest SDK's Windbg. You can use the .scriptproviders command to know what the various script providers currently loaded are, and if you do not see the Javascript provider you can just run .load jsprovider.dll to load it.
0:003> .scriptproviders
Available Script Providers:
    NatVis (extension '.NatVis')

0:003> .load jsprovider.dll

0:003> .scriptproviders
Available Script Providers:
    NatVis (extension '.NatVis')
    JavaScript (extension '.js')
How to debug a script?
One thing I have not experimented with yet is the .scriptdebug command that lets you debug a script. This is a very important feature as without it it can be a bit of a pain to figure out what is going wrong and where. If you want to know more about this, please refer to Script Debugging Walkthrough from Andy Luhrs.
How to do Nat-Vis style visualizer in Javascript?
I did not cover how to write custom visualizer in Javascript but you should look at host.typeSignatureRegistration to register a class that is responsible for visualizing a type (every property of the class will be used as the main visualizers for the type).
Get a value out of a typed object
Sometimes you are accessing a Javascript object that behaves like a structure instance -- you can access its various fields seamlessly (e.g. you want to access the TEB through the EnvironmentBlock object). This is great. However, for various reasons you might need to get the raw value of a field (e.g. for doing arithmetic) and for that you can use the address property:
// address property
"use strict";

let logln = function (e) {
    host.diagnostics.debugLog(e + '\n');
}

function invokeScript() {
    let CurrentThread = host.currentThread;
    let TEB = CurrentThread.Environment.EnvironmentBlock;
    logln(TEB.FlsData);
    logln(TEB.FlsData.address);
}
Which gives:
0:000>
[object Object]
2316561115408

0:000> dx @$curthread.Environment.EnvironmentBlock.FlsData
@$curthread.Environment.EnvironmentBlock.FlsData : 0x21b5dcd6910 [Type: void *]
Evaluate expressions
Another interesting function I wanted to mention is host.evaluateExpression. As the name suggests, it allows you to evaluate an expression; it is similar to when you use the dx operator but you can only use the language syntax (this means no ‘!’). Any expression you can evaluate through dx, you can evaluate through host.evaluateExpression. The neat thing about this, is that the resulting expression keeps the type information and as a result the Javascript object behaves like the type of the expression.
Here is a small example showing what I am trying to explain:
// host.evaluateExpression
"use strict";

let logln = function (e) {
    host.diagnostics.debugLog(e + '\n');
}

function invokeScript() {
    logln(host.evaluateExpression('(unsigned __int64)0'));
    logln(host.evaluateExpression('(unsigned __int64*)0'));
    logln(host.evaluateExpression('(_TEB*)0xb87f4e4000').FlsData);
    logln(host.evaluateExpression('(_TEB*)0xb87f4e4000').FlsData.address);
    try{
        logln(host.evaluateExpression('(unsigned __int64*)0').dereference());
    } catch(e) {
        logln(e);
    }
    // not valid: @$ is not part of the language - logln(host.evaluateExpression('@$teb'));
    // not valid: @rsp is not part of the language - logln(host.evaluateExpression('(unsigned __int64)@rsp'));
    // not valid: '!' is not part of the language - logln(host.evaluateExpression('((ntdll!_TEB*)0)'))
}
Resulting in:
0:000>
0
[object Object]
[object Object]
2316561115408
Error: Unable to read memory at Address 0x0
How to access global from modules
If you need to get access to a global in a specific module, you can use the function host.getModuleSymbol which returns one of those magic Javascript object behaving like a structure. You can check out an example in the following article: Implementation logic for the COM global interface table.
x64 exception handling vs Javascript
Phew, you made it to the last part! This one is more about trying to do something useful with all the small little things we have learned throughout this article.
I am sure you guys all already know all of this but Windows revisited how exception handling and frame unwinding work on its 64 bit operating systems. Once upon a time the exception handlers could be found directly onto the stack and they formed some sort of linked list. Today, the compiler encodes every static exception handler at compile / link time into various tables embedded into the final binary image.
Anyway, you might know about Windbg's !exchains command that displays the current exception handler chain. This is what the output looks like:
(9a0.14d4): Access violation - code c0000005 (first chance)
First chance exceptions are reported before any exception handling.
This exception may be expected and handled.
except!Fault+0x3d:
00007ff7`a900179d 48c70001000000  mov     qword ptr [rax],1 ds:00000000`00000001=????????????????

0:000> !exchain
8 stack frames, scanning for handlers...
Frame 0x01: except!main+0x59 (00007ff7`a9001949)
    ehandler except!ILT+900(__GSHandlerCheck_SEH) (00007ff7`a9001389)
Frame 0x03: except!__scrt_common_main_seh+0x127 (00007ff7`a9002327)
    ehandler except!ILT+840(__C_specific_handler) (00007ff7`a900134d)
Frame 0x07: ntdll!RtlUserThreadStart+0x21 (00007ff8`3802efb1)
    ehandler ntdll!_C_specific_handler (00007ff8`38050ef0)
And here is the associated C code:
// except.c
__declspec(noinline) void Fault(uintptr_t *x) {
    printf("I'm about to fault!");
    *(uintptr_t*)x= 1;
}

int main(int argc, char **argv)
{
    __try {
        printf("Yo!\n");
        Fault((uintptr_t*)argc);
    }
    __except (Filter()) {
        printf("Exception!");
    }
    return EXIT_SUCCESS;
}
As you can see, it is not obvious from the dump above to identify the Filter function and the __except code block.
I figured it would be a good exercise to parse those tables (at least partially) from Javascript, expose the information inside the data model, and write a command similar to !exchain - so let's do it.
A few words about ImageRuntimeFunctionEntries, UnwindInfos, SehScopeTables and CSpecificHandlerDatas
Before giving you the script, I would just like to spend a bit of time to give you a brief overview of how this information is encoded and embedded inside a PE32+ binary. Note that I am only interested by x64 binaries coded in C; in other words I am focusing on SEH (__try / __except) as opposed to C++ EH (try / catch).
The first table we need to look at is the ENTRY_EXCEPTION table that resides in the DataDirectory of the OptionalHeader. This directory is an array of IMAGE_RUNTIME_FUNCTION_ENTRY that describes the boundary of functions (handy for IDA!) and their unwinding information which is stored at the end of this structure.
The unwinding information is mainly described by the UNWIND_INFO structure in which the frame unwinder can find what is necessary to unwind a stack-frame associated to this function. The array of UNWIND_CODE structures basically tells you how to do an epilogue.
What follows this array is variable though (documented here): if the Flags field of UNWIND_INFO specifies the EHHANDLER flag then we have what I call a UNWIND_INFO_END structure defined like this:
0:000> dt UNWIND_INFO_END
    +0x000 ExceptionHandler : Uint4B
    +0x004 ExceptionData    : Uint4B
This is basically where !exchains stops -- the ehhandler address in the output is the ExceptionHandler field. This is basically an RVA to a function that encapsulates the exception handling for this function. This is not to be confused with either your Filter function or your __except block, this is a generic entry-point that the compiler generates and can be used for other functions too. This function is invoked by the exception dispatching / handling code with an argument that is the value of ExceptionData. ExceptionData is basically an RVA to a blob of memory that the ExceptionHandler function knows how to read and takes actions on. This is where the information we are after is stored.
This is also where it was a bit of a surprise to me, as you basically cannot really tell for sure what type of structure is referenced by ExceptionData. For that, you would have to analyze the ExceptionHandler function to understand what and how this data is used. That is also most likely, why the !exchains command stops here and does not bother trying to parse the exception data blob.
Obviously we can easily make an assumption and assume that the ExceptionData is the structure we would like it to be, and verify that it looks right. In addition, the fact that the code you are most likely looking at has been emitted by a well behaved compiler and that the binary has not been tampered with combined have given me good enough results. But keep in mind that in theory, you could place your own function and have your own ExceptionData format in which case reverse-engineering the handler would be mandatory - in practice this is an unlikely scenario if you are dealing with normal binaries.
The type of ExceptionData that we are interested in is what I call a SEH_SCOPE_TABLE which is an array of SCOPE_RECORDs that are defined like this:
0:000> dt SEH_SCOPE_TABLE
    +0x000 Count            : Uint4B
    +0x004 ScopeRecord      : [1] SCOPE_RECORD

0:000> dt SCOPE_RECORD
    +0x000 BeginAddress     : Uint4B
    +0x004 EndAddress       : Uint4B
    +0x008 HandlerAddress   : Uint4B
    +0x00c JumpTarget       : Uint4B
BeginAddress and EndAddress give you the __try block RVA, HandlerAddress encodes either the Filter function or the start of the __finally block. The JumpTarget field tells you if you are looking at either a __try / __except or a __try / __finally. Also, the current heuristic I use to know if the SCOPE_RECORD looks legit or not is to ensure that the __try block resides in between the boundaries of the function the handler is defined in. This has been working well so far - at least on the binaries I have tried it on, but I would not be that surprised if there exists some edge cases to this; if you know any feel free to hit me up!
Putting it all together
All right, so now that we sort of know how to dig out the information we are interested in, you can check the script I came up with: parse_eh_win64.js.
This extends both the Process and the Module models. In both of those models it adds a Functions node as well as a ExceptionHandlers node. Each node under Functions has an ExceptionHandlers node too.
This basically means that you can now:
- Get every exception handler registered in the process regardless of which module it is coming from (using
Process.ExceptionHandlers) - Get every exception handler registered by a specific module (using
Module.ExceptionHandlers) - Get every function in the process address space (using
Process.Functions) - Get every function in a specific module (using
Module.Functions) - Get every exception handler defined by a specific function (using either
Module.Functions[x].ExceptionHandlersorProcess.Functions[x].ExceptionHandlers)
With the same source of information we can easily filter and shape the way we want it displayed through the data model. There is no need to display every exception handler from the Module node as it would not be information related to a Module -- this is why we choose to filter it out and display only the ones concerning this Module. Same thing reasoning applies to Functions as well. The model is something you should explore step by step, it is not something where you have all the available information displayed at once - it is meant to be scoped and not overwhelming.
And just in case you forgot about it, all this information is now accessible from the command window for query purposes. You can ask things like Which function defines the most exception handlers? very easily:
0:000> dx @$curprocess.Functions.OrderByDescending(c => c.ExceptionHandlers.Count()).First()
@$curprocess.Functions.OrderByDescending(c => c.ExceptionHandlers.Count()).First()                 : RVA:0x7ff83563e170 -> RVA:0x7ff83563e5a2, 12 exception handlers
    EHHandlerRVA     : 0x221d6
    EHHandler        : 0x7ff8356021d6
    BeginRVA         : 0x5e170
    EndRVA           : 0x5e5a2
    Begin            : 0x7ff83563e170
    End              : 0x7ff83563e5a2
    ExceptionHandlers :   __try {0x7ff83563e1d2 -> 0x7ff83563e37a} __finally {0x7ff83563e5a2}...

0:000> u 0x7ff83563e170 l1
KERNEL32!LoadModule:
00007ff8`3563e170 4053            push    rbx
In this example, the function KERNEL32!LoadModule seems to be the function that has registered the largest number of exception handlers (12 of them).
Now that we have this new source of information, we can also push it a bit further and implement a command that does a very similar job than !exchain by just mining information from the nodes we just added to the data model:
0:000> !ehhandlers
9 stack frames, scanning for handlers...
Frame 0x1: EHHandler: 0x7ff7a9001389: except!ILT+900(__GSHandlerCheck_SEH):
                Except: 0x7ff7a900194b: except!main+0x5b [c:\users\over\documents\blog\except\except\except.c @ 28]:
                Filter: 0x7ff7a9007e60: except!main$filt$0 [c:\users\over\documents\blog\except\except\except.c @ 27]:
Frame 0x3: EHHandler: 0x7ff7a900134d: except!ILT+840(__C_specific_handler):
                Except: 0x7ff7a900235d: except!__scrt_common_main_seh+0x15d [f:\dd\vctools\crt\vcstartup\src\startup\exe_common.inl @ 299]:
                Filter: 0x7ff7a9007ef0: except!`__scrt_common_main_seh'::`1'::filt$0 [f:\dd\vctools\crt\vcstartup\src\startup\exe_common.inl @ 299]:
Frame 0x7: EHHandler: 0x7ff838050ef0: ntdll!_C_specific_handler:
                Except: 0x7ff83802efc7: ntdll!RtlUserThreadStart+0x37:
                Filter: 0x7ff8380684d0: ntdll!RtlUserThreadStart$filt$0:
@$ehhandlers()

0:000> !exchain
8 stack frames, scanning for handlers...
Frame 0x01: except!main+0x59 (00007ff7`a9001949)
    ehandler except!ILT+900(__GSHandlerCheck_SEH) (00007ff7`a9001389)
Frame 0x03: except!__scrt_common_main_seh+0x127 (00007ff7`a9002327)
    ehandler except!ILT+840(__C_specific_handler) (00007ff7`a900134d)
Frame 0x07: ntdll!RtlUserThreadStart+0x21 (00007ff8`3802efb1)
    ehandler ntdll!_C_specific_handler (00007ff8`38050ef0)
We could even push it a bit more and have our command returns structured data instead of displaying text on the output so that other commands and extensions could build on top of it.
EOF
Wow, sounds like you made it to the end :-) I hope you enjoyed the post and ideally it will allow you to start scripting Windbg with Javascript pretty quickly. I hope to see more people coming up with new scripts and/or tools based on the various technologies I touched on today. As usual, big thanks to my buddy yrp604 for proofreading and edits.
If you are still thirsty for more information, here is a collection of links you should probably check out:
- Defrag Tools #170 - Debugger - JavaScript Scripting
- Defrag Tools #182 - WinDbg Preview Part 1
- Defrag Tools #183 - WinDbg Preview Part 2
- Defrag Tools #184 - JavaScript in WinDbg Preview
- Defrag Tools #185 - Time Travel Debugging - Introduction
- Defrag Tools #186 - Time Travel Debugging - Advanced
- Improving automated analysis of windows x64 binaries
- Programming against the x64 exception handling support series
- Exceptional behavior: the Windows 8.1 X64 SEH Implementation
南来地,北往的,上班的,下岗的,走过路过不要错过!
======================个性签名=====================
之前认为Apple 的iOS 设计的要比 Android 稳定,我错了吗?
下载的许多客户端程序/游戏程序,经常会Crash,是程序写的不好(内存泄漏?刚启动也会吗?)还是iOS本身的不稳定!!!
如果在Android手机中可以简单联接到ddms,就可以查看系统log,很容易看到程序为什么出错,在iPhone中如何得知呢?试试Organizer吧,分析一下Device logs,也许有用.


【推荐】国内首个AI IDE,深度理解中文开发场景,立即下载体验Trae
【推荐】编程新体验,更懂你的AI,立即体验豆包MarsCode编程助手
【推荐】抖音旗下AI助手豆包,你的智能百科全书,全免费不限次数
【推荐】轻量又高性能的 SSH 工具 IShell:AI 加持,快人一步
· 震惊!C++程序真的从main开始吗?99%的程序员都答错了
· 【硬核科普】Trae如何「偷看」你的代码?零基础破解AI编程运行原理
· 单元测试从入门到精通
· 上周热点回顾(3.3-3.9)
· winform 绘制太阳,地球,月球 运作规律
2015-02-06 你确信你了解时间吗?