
WinDbg cheatsheet
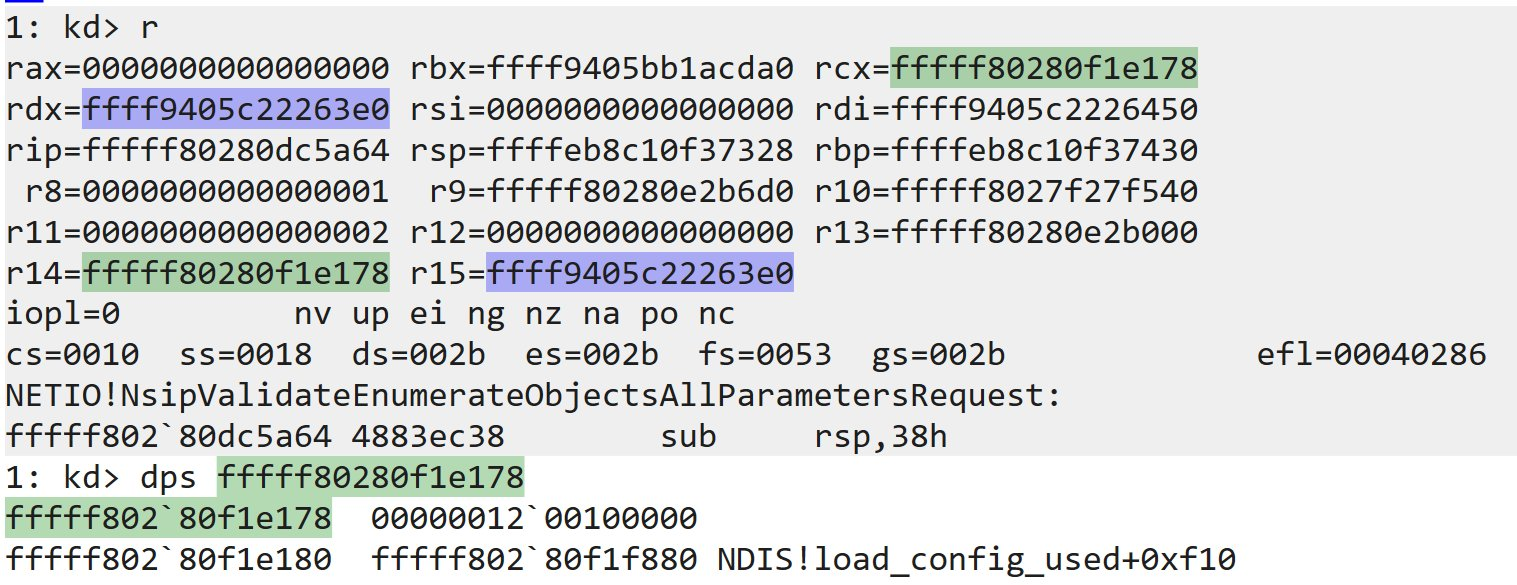
Did you know you can mark things in WinDbg in different colors to keep track of repeated values? I find it super useful when debugging things involving large data structures with no available symbols, Ctrl+Click
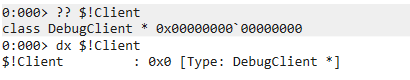
WinDbg tip: You can prefix a variable name with "$!" to tell the debugger that you only want to look for local variables. Otherwise, it assumes it could be a global variable and may try to download symbols for every loaded module. This works for ??, dx, and the watch window
Content
- WinDbg cheatsheet
Setup
Symbol Path
In a command prompt:
C:\> setx _NT_SYMBOL_PATH srv*C:\Symbols*https://msdl.microsoft.com/download/symbols
In WinDbg, Ctrl+S then
srv*C:\Symbols*https://msdl.microsoft.com/download/symbols

************* Path validation summary **************
Response                         Time (ms)     Location
Deferred                                       srv*
OK                                             F:\Yangl\2023\01
OK                                             C:\Users\bosd\Documents\Visual Studio 2010\Projects\TestWcfBytes\WcfService1\bin
0:035> .reload
Reloading current modules

************* Symbol Loading Error Summary **************
Module name            Error
SharedUserData         No error - symbol load deferred
You can troubleshoot most symbol related issues by turning on symbol loading diagnostics (!sym noisy) and repeating the command that caused symbols to be loaded.
You should also verify that your symbol search path (.sympath) is correct.
0:035> lm
start             end                 module name
00000000`77940000 00000000`77966000   mdnsNSP    (deferred)
000001fd`21150000 000001fd`2118b000   IISRES     (deferred)
000001fd`21c50000 000001fd`21c5a000   Microsoft_VisualStudio_Web_PageInspector_Loader   (deferred)
000001fd`21c60000 000001fd`21c6e000   W3wp       (deferred) F:\yangl\DebuggingPaths\dbg\sym\w3wp.pdb....
000001fd`21c70000 000001fd`21c78000   WcfService1   (deferred)  0:035> lmDvmWcfService1
Browse full module list
start             end                 module name
000001fd`21c70000 000001fd`21c78000   WcfService1   (deferred)
    Image path: C:\Windows\Microsoft.NET\Framework64\v4.0.30319\Temporary ASP.NET Files\root\19da4716\88842903\assembly\dl3\8f84f914\7c0f3747_898fd501\WcfService1.dll
    Image name: WcfService1.dll
    Browse all global symbols  functions  data
    Has CLR image header, track-debug-data flag not set
    Timestamp:        Thu Oct 31 09:19:44 2019 (5DBA36B0)
    CheckSum:         00000000
    ImageSize:        00008000
    File version:     1.0.0.0
    Product version:  1.0.0.0
    File flags:       0 (Mask 3F)
    File OS:          4 Unknown Win32
    File type:        2.0 Dll
    File date:        00000000.00000000
    Translations:     0000.04b0
    Information from resource tables:
        CompanyName:
        ProductName:      WcfService1
        InternalName:     WcfService1.dll
        OriginalFilename: WcfService1.dll
        ProductVersion:   1.0.0.0
        FileVersion:      1.0.0.0
        FileDescription:  WcfService1
        LegalCopyright:   Copyright ©  2019
        LegalTrademarks:
        Comments:         0:035> x /D WcfService1!w*
 A B C D E F G H I J K L M N O P Q R S T U V W X Y Z

00007ffb`d0201ab0 WcfService1!WcfService1.ajaxWcf.Page_Load (void)
00007ffb`d02007e0 WcfService1!WcfService1.ajaxWcf..ctor (void)
00007ffb`d0201e80 WcfService1!WcfService1.Service1.GetName (void)
00007ffb`d0201e30 WcfService1!WcfService1.Service1..ctor (void)
00007ffb`d0201ab0 WcfService1!WcfService1.ajaxWcf.Page_Load (void)
00007ffb`d02007e0 WcfService1!WcfService1.ajaxWcf..ctor (void)
00007ffb`d0201e80 WcfService1!WcfService1.Service1.GetName (void)
00007ffb`d0201e30 WcfService1!WcfService1.Service1..ctor (void)
Providers
In WinDbg
0:000> .scriptproviders
Should display something like
Available Script Providers:
    NatVis (extension '.NatVis')
    JavaScript (extension '.js')
VS Code linting
Download JsProvider.d.ts to the root of your script and add the following at its top:
/// <reference path="JSProvider.d.ts" />
"use strict";
Kernel Debugging
- Increase the kernel verbosity level from calls to
KdPrintEx()- temporarily during runtime from WinDbg (lost once session is closed)
kd> ed nt!Kd_Default_Mask 0xf
- permanently from registry hive (in Admin prompt on Debuggee)
C:\> reg add "HKLM\SYSTEM\CurrentControlSet\Control\Session Manager\Debug Print Filter" /v DEFAULT /t REG_DWORD /d 0xffff
Commands
Basic commands
| Action | Command | Examples |
|---|---|---|
| Help / Manual | .hh <command> |
.hh.hh !process |
| Clear screen | .cls |
|
| Dynamic evaluation | ? |
? 40004141 – nt? 2 + 2? nt!ObTypeArrayIndex |
| Comment | $$ |
$$ this is a useful comment |
| Print a string | .echo |
.echo "Hello world" |
| Print a formatted string (see printf formatters) |
.printf |
.printf "Hello %ma\n" , @$esp |
| Command separator | ; |
command1 ; command2 |
| Attach (Detach) to (from) process | .attach |
.detach |
| Display parameter value under different formats (hexadcimal, decimal, octal) | .formats |
.formats 0x42 |
| Change default base | n |
n 8 |
| Quit WinDbg (will kill the process if not detached) | q |
|
| Restart debugging session | .restart |
|
| Reboot system (KD) | .reboot |
.printf formatters
| Description | Formatter | Examples |
|---|---|---|
| ASCII C string (i.e. NULL terminated) | %ma |
|
| Wide C string (i.e. NULL terminated) | %mu |
|
| UNICODE_STRING** string | %msu |
|
| Print the symbol pointed by address | %y |
.printf “%y\n”,ffff8009bc2010 // returns nt!PsLoadedModuleList |
| Print a Pointer | %p |
.printf “%p\n”,nt!PsLoadedModuleList // returns 0xffff8009bc2010 |
Execution flow
| Action | Command | Examples |
|---|---|---|
| Start or resume execution (go) | g |
|
| Dump register(s) | r |
rr eaxr rax=42 |
| Step over | p |
pa 0xaddr (step over until 0xaddr is reached)pt (step over until return)pc (step over until next call) |
| Step into | t |
Same as above, replace p with t |
| Execute until reaching current frame return address (go upper) | gu |
|
| List module(s) | lm |
lm (UM: display all modules)lm (KM: display all drivers and sections)lm m *MOD* (show module with pattern 'MOD' ) |
| Get information about current debugging status | .lastevent!analyze |
|
| Show stack call | kkp |
Registers / Memory access
| Action | Command | Examples |
|---|---|---|
| Read memory As | bytes: dbword: dwdword: ddqword: dqpointer: dpunicode string: dW |
db @sp 41 41 41 41dw @ripdd @rax l4dyb @ripdps @espdW @rsp |
| Write memory As | bytes: ebword: ewdword: edqword: eqascii string: eaUnicode string: eu |
ea @pc "AAAA" |
| Read register(s) | rr [[REG0],REG1,...] |
r rax,rbp |
| Write register(s) | r [REG]=[VALUE] |
r rip=4141414141414141 |
| Show register(s) modified by the current instruction | r. |
|
| Dump memory to file | .writemem |
.writemem C:\mem.raw @eip l1000 |
| Load memory from file | .readmem |
.readmem C:\mem.raw @rip l1000 |
| Dump MZ/PE header info | !dh |
!dh kernel32!dh @rax |
| Read / write physical memory (syntax similar to dX/eX commands) |
!db / !eb!dw / !ew!dd / !ed!dq / !eq |
|
| Fill / Compare memory | fc |
f @rsp l8 41c @rsp l8 @rip |
| Dereference memory | poi(<AddrOrSymbol>): dereference pointer sizewo(): dereference WORDdwo(): dereference DWORDqwo(): dereference QWORD |
db poi( @$rax ) |
Memory search
| Action | Command | Examples |
|---|---|---|
| Search | byte: s [RANGE] [VALUE]dword: s -d [RANGE] [DWORD_VALUE] |
s @eip @eip+100 90 90 90 ccs -d @eax l100 41424344 |
| Search ASCII (Unicode) | s –a <AddrStart> L<NbByte> "Pattern"s –a <AddrStart> <AddrEnd> "Pattern"(for Unicode – change –a with –u) |
|
| Search for pattern in command | .shell |
.shell -ci "<windbg command>" batch command.shell -ci "!address" findstr PAGE_EXECUTE_READWRITE |
Breakpoints
| Action | Command | Examples |
|---|---|---|
| Examine | x |
x nt!*CreateProcess* |
| Display types | dt |
dt ntdll!_PEB @$pebdt ntdll!_TEB –r @$teb |
| Display Type Extended - with Debugger Object Model | dtx |
dtx nt!_PEB 0x000008614a7a000which is equivalent to dx (nt!_PEB*)0x000008614a7a000 |
| Set breakpoint | bp bp 0xaddr (or mod!symbol) |
|
| List breakpoints | bl |
|
| Disable breakpoint(s) | bd [IDX] (IDX is returned by bl) |
bd 1bd * |
| Delete breakpoint(s) | bc [IDX] (IDX is returned by bl) |
bc 0bc * |
| (Un)Set exception on event | sx |
sxe ld mydll.dll |
| Break on memory access | ba |
ba r 4 @esp |
| Define breakpoint command | bp … [Command]Where [Command] can be - an action: " r ; g"- a condition: " .if (@$rax == 1) {.printf \"rcx=%p\\\n\", @rcx }" |
bp kernel32!CreateFileA "da @rcx; g" " |
| Enable breakpoint after N hit(s) | bp <address> N+1 |
bp /1 0xaddr (temporary breakpoint)bp 0xaddr 7 (disable after 6 hits) |
| Set "undefined" breakpoint | bu <address> |
Symbols
| Action | Command | Examples |
|---|---|---|
| Examine | x |
x /t /v ntdll!*CreateProcess* |
| Display types | dt |
dt ntdll!_PEB @$peb |
| List nearest symbols | ln |
ln 0xaddr |
| Set/update symbol path | .sympath |
|
| Load module symbols | ld |
ld Moduleld * |
Convenience variables and functions
| Action | Command | Examples |
|---|---|---|
| Program entry point | $exentry |
bp $exentry |
| Process Environment Block | $peb |
dt _PEB @$peb |
| Thread Environment Block | $teb |
dt _TEB @$teb |
| Return Address | $ra |
g @ra |
| Instruction Pointer | $ip |
|
| Size of Page | $pagesize |
|
| Size of Pointer | $ptrsize |
|
| Process ID | $tpid |
|
| Thread ID | $tid |
Useful extensions
| Action | Command | Examples |
|---|---|---|
| Detailed information about loaded DLLs | !dlls!dlls -I (show load order)!dlls -c 0xaddr (show DLL containing0xaddr) |
|
| Get mapping information | !address |
!address -f:MEM_COMMIT |
| Change verbosity of symbol loader | !sym |
!sym noisy!sym quiet |
| Dump PEB/TEB information | !peb!teb |
|
| Analyze the reason of a crash | !analyze |
!analyze -v |
| Convert an NTSTATUS code to text | !error |
!error c0000048 |
| Perform heuristic checks to the exploitability of a bug |
!exploitable |
|
| Encode/decode pointer encoded by KernelBase API EncodePointer() |
!encodeptr32 (or 64)!decodeptr32 (or 64) |
|
| Display the current exception handler | !exchain |
|
| Dump UM heap information | !heap |
.NET Debugging
| Action | Command | Examples |
|---|---|---|
| Load the CLR extensions | .loadby sos clr |
sxe ld clr; g to make sure clr.dll is loaded, then .loadby sos clr |
| Get help | !help |
|
| Set managed code breakpoint | !bpmd <module> Path.To.Function |
!bpmd mscorlib.dll System.Reflection.Assembly.Load!bpmd System.dll System.Diagnostics.Process.Start!bpmd System.dll System.Net.WebClient.DownloadFile |
| List all managed code breakpoints | !bpmd -list |
|
| Clear specific managed code breakpoint | !bpmd -clear $BreakpointNumber |
|
| Clear all managed code breakpoints | !bpmd -clearall |
|
| Dump objects | !DumpObj |
!DumpObj /d 0x<address> |
| Dump the .NET stack | !CLRStack |
!CLRStack -p |
LINQ & Debugger Data Model
Variables
| Variable description | Command | Examples |
|---|---|---|
| Create a variable | dx @$myVar = VALUE |
dx @$ps = @$cursession.Processes |
| Delete a variable | dx @$vars.Remove("VarName") |
dx @$vars.Remove("ps") |
| List user defined variable | dx @$varsdx Debugger.State.UserVariables |
|
Bind address Address toa N-entry array of type T |
dx (T* [N])0xAddress |
dx (void** [5]) Debugger.State.PseudoRegisters.General.csp |
Functions
| Function description | Command | Examples |
|---|---|---|
| Create a "lambda" inline function | dx @$my_function = ([arg0, arg1] => Code) |
dx @$add = (x, y => x + y) |
| Filtering objects | [Object].Where( [FILTER PATTERN] ) |
dx @$cursession.Processes.Where( x => x.Name == "notepad.exe") |
| Sorting objects | - asc: [Object].OrderBy([Sort Expression])- desc: [Object].OrderByDescending([Sort Expression]) |
dx @$cursession.Processes.OrderByDescending(x => x.KernelObject.UniqueProcessId) |
| Projecting | .Select( [PROJECTION KEYS] ) |
.Select( p => new { Item1 = p.Name, Item2 = p.Id } ) |
Access n-th element of iterable |
$Object[n] |
@$cursession.Processes[4] |
Get the number of objects in iterable |
$Object.Count() |
@$cursession.Processes.Count() |
Create a iterator from a LIST_ENTRY structure |
dx Debugger.Utility.Collections.FromListEntry(Address, TypeAsString, "TypeMemberNameAsString") |
dx @$ProcessList = Debugger.Utility.Collections.FromListEntry( *(nt!_LIST_ENTRY*)&(nt!PsActiveProcessHead), "nt!_EPROCESS", "ActiveProcessLinks")dx @$HandleList = Debugger.Utility.Collections.FromListEntry( *(nt!_LIST_ENTRY*)&(nt!PspCidTable), "nt!_HANDLE_TABLE", "HandleTableList") |
Apply a structure S to memory (dt-like) |
dx (S*)0xAddress |
dx (nt!_EPROCESS*)&@$curprocess.KernelObject |
| Format output data | dx <LinqObject>.ToDisplayString($format)where $format can be
|
dx @$peb->ProcessParameters->ImagePathName.Buffer.ToDisplayString("su" |
Format specifiers for .ToDisplayString() |
WinDbg JavaScript reference
| Action | Command | Examples |
|---|---|---|
| Print message | host.diagnostics.debugLog(Message) |
|
| Read data from memory | host.memory.readMemoryValues(0xAddr, Length) |
|
| Read string from memory | host.memory.readString(0xAddr)host.memory.readWideString(0xAddr) |
|
| Evaluate expression | host.evaluateExpression([EXPR]) |
var res=host.evaluateExpression("sizeof(_LIST_ENTRY)")dx @$scriptContents.host.evaluateExpression("sizeof(_LIST_ENTRY)") |
| Resolve symbol | host.getModuleSymbolAddress(mod, sym) |
var pRtlAllocateHeap = host.getModuleSymbolAddress('ntdll', 'RtlAllocateHeap'); |
| Dereference a pointer as an object | host.createPointerObject(...).dereference() |
var pPsLoadedModuleHead = host.createPointerObject(host.getModuleSymbolAddress("nt", "PsLoadedModuleList"), "nt", "_LIST_ENTRY *"); |
| Create typed variable from address | host.createTypedObject(addr, module, symbol) |
var loader_data_entry = host.createTypedObject(0xAddress,"nt","_LDR_DATA_TABLE_ENTRY") |
| Dereference memory | host.evaluateExpression('(int*)0xADDRESS').dereference() |
|
| Get access to the Pseudo-Registers | host.namespace.Debugger.State.PseudoRegisters |
var entrypoint = host.namespace.Debugger.State.PseudoRegisters.General.exentry.address; |
| Execute WinDbg command | host.namespace.Debugger.Utility.Control.ExecuteCommand |
var modules=host.namespace.Debugger.Utility.Control.ExecuteCommand("lm"); |
| Set Breakpoint | host.namespace.Debugger.Utility.Control.SetBreakpointAtSourceLocationhost.namespace.Debugger.Utility.Control.SetBreakpointAtOffsethost.namespace.Debugger.Utility.Control.SetBreakpointForReadWrite |
|
Iterate through LIST_ENTRYs |
host.namespace.Debugger.Utility.Collections.FromListEntry() |
var process_iterator = host.namespace.Debugger.Utility.Collections.FromListEntry( pAddrOfPsActiveProcessHead, "nt!_EPROCESS", "ActiveProcessLinks") |
Dealing with host.Int64
| Action | Command | Examples |
|---|---|---|
Create/Convert an Int64 object |
host.parseInt64('value')host.parseInt64('value', 16 ) |
host.parseInt64('42');host.parseInt64('0x1337', 16); |
| Add / Subtract | [Int64Obj].add($int)[Int64Obj].subtract($int) |
var NextPage = BasePage.add(0x1000);var NextPage = BasePage.subtract(0x1000); |
| Multiply / Divide | [Int64Obj].multiply($int)[Int64Obj].divide($int) |
|
| Compare | [Int64Obj1].compareTo([Int64Obj2]) |
BasicBlock.StartAddress.compareTo(Address1) <= 0 |
| Bitwise operation | and: [Int64Obj].bitwiseAnd($int)or: [Int64Obj].bitwiseOr($int)xor: [Int64Obj].bitwiseXor($int)lsh: [Int64Obj].bitwiseShiftLeft($shift)rsh: [Int64Obj].bitwiseShiftRight($shift) |
var PageBase = Address.bitwiseAnd(0xfffff000);Address.bitwiseShiftLeft(12).bitwiseShiftRight(12); |
Convert Int64 to native number |
- with exception if precision loss: [Int64Obj].asNumber()- no exception if precision loss: [Int64Obj].convertToNumber() |
WinDbg gallery skeleton
Only 3 files are needed (see [5] for more details):
config.xml
<?xml version="1.0" encoding="UTF-8"?>
<Settings Version="1">
  <Namespace Name="Extensions">
    <Setting Name="ExtensionRepository" Type="VT_BSTR" Value="Implicit"></Setting>
    <Namespace Name="ExtensionRepositories">
      <Namespace Name="My Awesome Gallery">
        <Setting Name="Id" Type="VT_BSTR" Value="any-guid-will-do"></Setting>
        <Setting Name="LocalCacheRootFolder" Type="VT_BSTR" Value="\absolute\path\to\the\xmlmanifest\directory"></Setting>
        <Setting Name="IsEnabled" Type="VT_BOOL" Value="true"></Setting>
      </Namespace>
    </Namespace>
  </Namespace>
</Settings>
ManifestVersion.txt
1
1.0.0.0
1
Manifest.X.xml(whereXis the version number, let's just use1so it isManifest.1.xml)
<?xml version="1.0" encoding="utf-8"?>
<ExtensionPackages Version="1.0.0.0" Compression="none">
  <ExtensionPackage>
    <Name>Script1</Name>
    <Version>1.0.0.0</Version>
    <Description>Description of Script1.</Description>
    <Components>
      <ScriptComponent Name="Script1" Type="Engine" File=".\relative\path\to\Script1.js" FilePathKind="RepositoryRelative">
        <FunctionAliases>
          <FunctionAlias Name="AliasCreatedByScript`">
            <AliasItem>
              <Syntax><![CDATA[!AliasCreatedByScript]]></Syntax>
              <Description><![CDATA[Quick description of AliasCreatedByScript.]]></Description>
            </AliasItem>
          </FunctionAlias>
        </FunctionAliases>
      </ScriptComponent>
    </Components>
  </ExtensionPackage>
</ExtensionPackages>
Then in WinDbg load & save:
0:000> .settings load \path\to\config.xml
0:000> .settings save
Time-Travel Debugging
| Action | Command | Examples |
|---|---|---|
| DDM Objects | @$curprocess.TTD@$cursession.TTD |
dx @$curprocess.TTD.Threads.First().Lifetimedx @$cursession.TTD.Calls("ntdll!Nt*File").Count() |
| Run execution back | g- |
|
| Reverse Step Over | p- |
|
| Reverse Step Into | t- |
|
| Regenerate the index | !ttdext.index |
|
Jump to position XX:YY (WinDbg) |
!tt XX:YY |
!tt 1B:0 |
Jump to position XX:YY (DDM) |
<TtdPosition>.SeekTo() |
dx @$curprocess.TTD.Lifetime.MinPosition.SeekTo() |
Additional resources
- WinDbg .printf formatters
- JavaScript Debugger Scripting
- WinDbg Pseudo-Register Syntax
- WinDbg Playlist on YouTube
- WinDbg Extension Gallery
- SOS commands for .NET debugging
在WinDBG中高亮你输入的命令, 从而和命令的结果输出区分开来
在WinDBG的Command窗口中, 默认情况下, 你输入的命令很容易和该命令以及附近命令的输出混杂在一起. 在寻找之前命令的结果的时候, 眼睛看起来会很累.
WinDBG提供了一个选项, 通过这个选项, 你可以把命令输入与输出的颜色进行设置.
选项名:
- Prompt level command window text
- Prompt level command windows text background
点击菜单View->Options...

配置后的结果如下:

南来地,北往的,上班的,下岗的,走过路过不要错过!
======================个性签名=====================
之前认为Apple 的iOS 设计的要比 Android 稳定,我错了吗?
下载的许多客户端程序/游戏程序,经常会Crash,是程序写的不好(内存泄漏?刚启动也会吗?)还是iOS本身的不稳定!!!
如果在Android手机中可以简单联接到ddms,就可以查看系统log,很容易看到程序为什么出错,在iPhone中如何得知呢?试试Organizer吧,分析一下Device logs,也许有用.


【推荐】国内首个AI IDE,深度理解中文开发场景,立即下载体验Trae
【推荐】编程新体验,更懂你的AI,立即体验豆包MarsCode编程助手
【推荐】抖音旗下AI助手豆包,你的智能百科全书,全免费不限次数
【推荐】轻量又高性能的 SSH 工具 IShell:AI 加持,快人一步
· 无需6万激活码!GitHub神秘组织3小时极速复刻Manus,手把手教你使用OpenManus搭建本
· Manus爆火,是硬核还是营销?
· 终于写完轮子一部分:tcp代理 了,记录一下
· 别再用vector<bool>了!Google高级工程师:这可能是STL最大的设计失误
· 单元测试从入门到精通
2015-02-06 你确信你了解时间吗?