
Enabling Postmortem Debugging
User Mode Exception Handling
Exceptions and Breakpoints
The most common application errors are called exceptions. These include access violations, division-by-zero errors, numerical overflows, CLR exceptions, and many other kinds of errors. Applications can also cause breakpoint interrupts. These occur when Windows is unable to run the application (for example, when a necessary module cannot be loaded) or when a breakpoint is encountered. Breakpoints can be inserted into the code by a debugger, or invoked through a function such as DebugBreak.
Exception Handlers Precedence
Based on configuration values and which debuggers are active, Windows handles user-mode errors in a variety of ways. The following sequence shows the precedence used for user mode error handling:
-
If a user-mode debugger is currently attached to the faulting process, all errors will cause the target to break into this debugger.
As long as the user-mode debugger is attached, no other error-handling methods will be used -- even if the gn (Go With Exception Not Handled) command is used.
-
If no user-mode debugger is attached and the executing code has its own exception handling routines (for example, try - except), this exception handling routine will attempt to deal with the error.
-
If no user-mode debugger is attached, and Windows has an open kernel-debugging connection, and the error is a breakpoint interrupt, Windows will attempt to contact the kernel debugger.
Kernel debugging connections must be opened during Windows' boot process. If you wish to prevent a user-mode interrupt from breaking into the kernel debugger, you can use the KDbgCtrl utility with the -du parameter. For details on how to configure kernel-debugging connections and how to use KDbgCtrl, see Getting Set Up for Debugging.
In the kernel debugger, you can use gh (Go With Exception Handled) to disregard the error and continue running the target. You can use gn (Go With Exception Not Handled) to bypass the kernel debugger and go on to step 4.
-
If the conditions in steps 1, 2, and 3 do not apply, Windows will activate a debugging tool configured in the AeDebug registry values. Any program can be selected in advance as the tool to use in this situation. The chosen program is referred to as the postmortem debugger.
-
If the conditions in steps 1, 2, and 3 do not apply, and there is no postmortem debugger registered, Windows Error Reporting (WER) displays a message and provides solutions if any are available. WER also writes a memory dump file if the appropriate values are set in the Registry. For more information, see Using WER and Collecting User-Mode Dumps.
DebugBreak Function
If a postmortem debugger has been installed, you can deliberately break into the debugger from a user-mode application by calling the DebugBreak function.
Specifying a Postmortem Debugger
This section describes how to configure tools such as WinDbg as the postmortem debugger. Once configured, the postmortem debugger will be automatically started whenever an application crashes.
Post Mortem Debugger Registry Keys
Windows Error Reporting (WER) creates the postmortem debugger process using the values set in the AeDebug registry key.
HKLM\Software\Microsoft\Windows NT\CurrentVersion\AeDebug
There are two primary registry values of interest, Debugger and Auto. The Debugger registry value specifies the command line for the postmortem debugger. The Auto registry value specifies if the postmortem debugger is automatically started, or if a confirmation message box is presented first.
Debugger (REG_SZ)
This REG_SZ value specifies the debugger that will handle postmortem debugging.
The full path to the debugger must be listed unless the debugger is located in a directory that is in the default path.
The command line is generated from the Debugger string via a printf style call that includes 3 parameters. Although the order is fixed, there is no requirement to use any or all of the available parameters.
DWORD (%ld) - Process ID of the target process.
DWORD (%ld) - Event Handle duplicated into the postmortem debugger process. If the postmortem debugger signals the event, WER will continue the target process without waiting for the postmortem debugger to terminate. The event should only be signaled if the issue has been resolved. If the postmortem debugger terminates without signaling the event, WER continues the collection of information about the target processes.
void* (%p) - Address of a JIT_DEBUG_INFO structure allocated in the target process’s address space. The structure contains additional exception information and context.
Auto (REG_SZ) This REG_SZ value is always either 0 or 1.
If Auto is set to 0, a confirmation message box is displayed prior to postmortem debugging process being started.
If Auto is set to 1, the postmortem debugger is immediately created.
When you manually edit the registry, do so very carefully, because improper changes to the registry may not allow Windows to boot.
Example Command Line Usage
Many postmortem debuggers use a command line that includes -p and -e switches to indicate the parameters are a PID and Event (respectively). For example, installing WinDbg via windbg.exe -I creates the following values:
Debugger = "<Path>\WinDbg -p %ld -e %ld -g"
Auto = 1
There is flexibility in how the WER %ld %ld %p parameters can be used. For example. there is no requirement to specify any switches around or between the WER parameters. For example, installing Windows Sysinternals ProcDump using procdump.exe -i creates the following values with no switches between the WER %ld %ld %p parameters:
Debugger = "<Path>\procdump.exe" -accepteula -j "c:\Dumps" %ld %ld %p
Auto = 1
32 and 64 bit Debuggers
On a 64-bit platform, the Debugger (REG_SZ) and Auto (REG_SZ) registry values are defined individually for 64-bit and 32-bit applications. An additional Windows on Windows (WOW) key is used to store the 32 bit application post mortem debugging values.
HKLM\Software\Wow6432Node\Microsoft\Windows NT\CurrentVersion\AeDebug
On a 64-bit platform, use a 32-bit post-mortem debugger for 32-bit processes and a 64-bit debugger for 64-bit processes. This avoids a 64-bit debugger focusing on the WOW64 threads, instead of the 32-bit threads, in a 32-bit process.
For many postmortem debuggers, including the Debugging Tools for Windows postmortem debuggers, this involves running the installation command twice; once with the x86 version and once with the x64 version. For example, to use WinDbg as the interactive postmortem debugger, the windbg.exe -I command would be run twice, once for each version.
64-bit Installation:
C:\Program Files (x86)\Windows Kits\10\Debuggers\x64\windbg.exe –I
This updates the registry key with these values.
HKEY_LOCAL_MACHINE\SOFTWARE\Microsoft\Windows NT\CurrentVersion\AeDebug
Debugger = "C:\Program Files (x86)\Windows Kits\10\Debuggers\x64\windbg.exe" -p %ld -e %ld –g
32-bit Installation:
C:\Program Files (x86)\Windows Kits\10\Debuggers\x86\windbg.exe –I
This updates the registry key with these values.
HKEY_LOCAL_MACHINE\SOFTWARE\WOW6432Node\Microsoft\Windows NT\CurrentVersion\AeDebug
Debugger = "C:\Program Files (x86)\Windows Kits\10\Debuggers\x86\windbg.exe" -p %ld -e %ld –g
Configuring Post Mortem Debuggers
Debugging Tools for Windows
The Debugging Tools for Windows debuggers all support being set as the postmortem debugger. The install command intends for the process to be debugged interactively.
WinDbg
To set the postmortem debugger to WinDbg, run windbg -I. (The I must be capitalized.) This command will display a success or failure message after it is used. To work with both 32 and 64 bit applications, run the command for the both the 64 and 32 debuggers.
C:\Program Files (x86)\Windows Kits\10\Debuggers\x64\windbg.exe –I
C:\Program Files (x86)\Windows Kits\10\Debuggers\x86\windbg.exe –I
This is how the AeDebug registry entry will be configured when windbg -I is run.
Debugger = "<Path>\WinDbg -p %ld -e %ld -g"
Auto = 1
In the examples, <Path> is the directory where the debugger is located.
The -p and -e parameters pass the Process ID and Event, as discussed previously.
The -g passes the g (Go) command to WinDbg and continues execution from the current instruction.
Note There is a significant issue passing the g (Go) command. The issue with this approach, is that exceptions do not always repeat, typically, because of a transient condition that no longer exists when the code is restarted. For more information about this issue, see .jdinfo (Use JIT_DEBUG_INFO).
To avoid this issue, use .jdinfo or .dump /j. This approach allows the debugger to be in the context of the code failure of interest. For more information, see Just In Time (JIT) Debugging later in this topic.
CDB
To set the postmortem debugger to CDB, run cdb -iae (Install AeDebug) or cdb -iaec KeyString (Install AeDebug with Command).
C:\Program Files (x86)\Windows Kits\10\Debuggers\x64\cdb.exe -iae
C:\Program Files (x86)\Windows Kits\10\Debuggers\x86\cdb.exe -iae
When the -iaec parameter is used, KeyString specifies a string to be appended to the end of command line used to launch the postmortem debugger. If KeyString contains spaces, it must be enclosed in quotation marks.
C:\Program Files (x86)\Windows Kits\10\Debuggers\x64\cdb.exe -iaec [KeyString]
C:\Program Files (x86)\Windows Kits\10\Debuggers\x86\cdb.exe -iaec [KeyString]
This command display nothing if it succeeds, and an error message if it fails.
NTSD
To set the postmortem debugger to NTSD, run ntsd -iae (Install AeDebug) or ntsd -iaec KeyString (Install AeDebug with Command).
C:\Program Files (x86)\Windows Kits\10\Debuggers\x64\ntsd.exe -iae
C:\Program Files (x86)\Windows Kits\10\Debuggers\x86\ntsd.exe -iae
When the -iaec parameter is used, KeyString specifies a string to be appended to the end of command line used to launch the postmortem debugger. If KeyString contains spaces, it must be enclosed in quotation marks.
C:\Program Files (x86)\Windows Kits\10\Debuggers\x64\ntsd.exe -iaec [KeyString]
C:\Program Files (x86)\Windows Kits\10\Debuggers\x86\ntsd.exe -iaec [KeyString]
This command display nothing if it succeeds, and an error to a new console window on failure.
Note Because the -p %ld -e %ld -g parameters always appear first on the command line of the postmortem debugger, you should not use the -iaec switch to specify the -server parameter because -server will not work unless it appears first on the command line. To install a postmortem debugger that includes this parameter, you must edit the registry manually.
Visual Studio JIT Debugger
If Visual Studio has been installed, vsjitdebugger.exe will be registered as the post mortem debugger. The Visual Studio JIT Debugger intends for the process to be debugged interactively.
Debugger = "C:\WINDOWS\system32\vsjitdebugger.exe" -p %ld -e %ld
If Visual Studio is updated or re-installed, this entry will be re-written, overwriting any alternate values set.
Window Sysinternals ProcDump
The Windows Sysinternals ProcDump utility can also be used for postmortem dump capture. For more information about using and downloading ProcDump, see ProcDump.
Like the .dump WinDbg command, ProcDump is able to be capture a dump of the crash non-interactively. The capture may occur in any Windows system session.
ProcDump exits when the dump file capture completes, WER then reports the failure and the faulting process is terminated.
Use procdump -i to install procdump and -u to uninstall ProcDump for both the 32 and 64 bit post mortem debugging.
<Path>\procdump.exe -i
The install and uninstall commands output the registry values modified on success, and the errors on failure.
The ProcDump command line options in the registry are set to:
Debugger = <Path>\ProcDump.exe -accepteula -j "<DumpFolder>" %ld %ld %p
ProcDump uses all 3 parameters - PID, Event and JIT_DEBUG_INFO. For more information on the JIT_DEBUG_INFO parameter, see Just In Time (JIT) Debugging below.
The size of dump captured defaults to Mini (process/threads/handles/modules/address space) without a size option set, MiniPlus (Mini plus MEM_PRIVATE pages) with -mp set, or Full (all memory - equivalent to ".dump /mA") with -ma set.
For systems with sufficient drive space, a Full (-ma) capture is recommended.
Use -ma with the -i option to specify an all memory capture. Optionally, provide a path for the dump files.
<Path>\procdump.exe -ma -i c:\Dumps
For systems with limited drive space, a MiniPlus (-mp) capture is recommended.
<Path>\procdump.exe -mp -i c:\Dumps
The folder to save the dump file to is optional. The default is the current folder. The folder should secured with an ACL that is equal or better than what is used for C:\Windows\Temp. For more information on managing security related to folders, see Security During Postmortem Debugging.
To uninstall ProcDump as the postmortem debugger, and restore the previous settings, use the -u (Uninstall) option.
<Path>\procdump.exe -u
For additional information on ProcDump, see ProcDump and Windows SysInternals Administrator's Reference by Mark Russinovich and Aaron Margosis published by Microsoft Press.
Just In Time (JIT) Debugging
Setting Context to the Faulting Application
As discussed previously, it is very desirable to set the context to the exception that caused the crash using the JIT_DEBUG_INFO parameter. For more information about this, see .jdinfo (Use JIT_DEBUG_INFO).
Debugging Tools for Windows
This example shows how to edit the registry to run an initial command (-c) that uses the .jdinfo <address> command to display the additional exception information, and change the context to the location of the exception (similar to how .ecxr is used set the context to the exception record).
Debugger = "<Path>\windbg.exe -p %ld -e %ld -c ".jdinfo 0x%p"
Auto = 1
The %p parameter is the address of a JIT_DEBUG_INFO structure in the target process’s address space. The %p parameter is pre-appended with 0x so that it is interpreted as a hex value. For more information, see .jdinfo (Use JIT_DEBUG_INFO).
To debug a mix of 32 and 64 bit apps, configure both the 32 and 64 bit registry keys (described above), setting the proper path to the location of the 64-bit and 32-bit WinDbg.exe.
Creating a dump file using .dump
To capture a dump file whenever a failure occurs that includes the JIT_DEBUG_INFO data, use .dump /j <address>.
<Path>\windbg.exe -p %ld -e %ld -c ".dump /j %p /u <DumpPath>\AeDebug.dmp; qd"
Use the /u option to generate a unique filename to allow multiple dump files to be automatically created. For more information about the options see, .dump (Create Dump File).
The created dump will have the JITDEBUG_INFO data stored as the default exception context. Instead of using .jdinfo to view the exception information and set the context, use .exr -1 to display the exception record and .ecxr to set the context. For more information see .exr (Display Exception Record) and .ecxr (Display Exception Context Record).
Windows Error Reporting - q / qd
The way the debug session ends determines if Windows Error Reporting reports the failure.
If the debug session is detached using qd prior to the closing of the debugger, WER will report the failure.
If the debug session is quit using q (or if the debugger is closed without detaching), WER will not report the failure.
Append ;q or ;qd to the end of the command string to invoke the desired behavior.
For example, to allow WER to report the failure after CDB captures a dump, configure this command string.
<Path>\cdb.exe -p %ld -e %ld -c ".dump /j 0x%p /u c:\Dumps\AeDebug.dmp; qd"
This example would allow WER to report the failure after WinDbg captures a dump.
<Path>\windbg.exe -p %ld -e %ld -c ".dump /j %p /u <DumpPath>\AeDebug.dmp; qd""
On an x86-based processor, the kv command also displays calling convention information.
When you use the kv command, the FPO information is added at the end of the line in the following format.
| FPO text | Meaning |
|---|---|
| FPO: [non-Fpo] | No FPO data for the frame. |
| FPO: [N1,N2,N3] | N1 is the total number of parameters.
N2 is the number of DWORD values for the local variables. N3 is the number of registers that are saved. |
| FPO: [N1,N2] TrapFrame @ Address | N1 is the total number of parameters.
N2 is the number of DWORD values for the locals. Address is the address of the trap frame. |
| FPO: TaskGate Segment:0 | Segment is the segment selector for the task gate. |
| FPO: [EBP 0xBase] | Base is the base pointer for the frame. |
Debugging Optimized Code and Inline Functions
For Windows 8, the debugger and the Windows compiler have been enhanced so that you can debug optimized code and debug inline functions. The debugger displays parameters and local variables regardless of whether they are stored in registers or on the stack. The debugger also displays inline functions in the call stack. For inline functions, the debugger displays local variables, but not parameters.
When code gets optimized, it is transformed to run faster and use less memory. Sometimes functions are removed as a result of dead code removal, code being merged, or functions being placed inline. Local variables and parameters can also be removed. Many code optimizations remove local variables that are not needed or used; other optimizations remove induction variables in loops. Common sub-expression elimination merges local variables together.
Retail builds of Windows are optimized. So if you are running a retail build of Windows, it is especially helpful to have a debugger that is designed to work well with optimized code. To make debugging of optimized code effective, two primary features are required: 1) accurate display of local variables, and 2) display of inline functions on the call stack.
Accurate display of local variables and parameters
To facilitate the accurate display of local variables and parameters, the compiler records information about the locations of local variables and parameters in symbol (PDB) files. These location records track the variables’ storage locations and the specific code ranges where these locations are valid. These records not only help track the locations (in registers or in stack slots) of the variables, but also the movement of the variables. For example, a parameter might first be in register RCX, but is moved to a stack slot to free up RCX, then moved to register R8 when it is heavily used in a loop, and then moved to different stack slot when the code is out of the loop. The Windows debugger consumes the rich location records in the PDB files and uses the current instruction pointer to select the appropriate location records for the local variables and parameters.
This screen shot of the Locals window in Visual Studio shows the parameters and local variables for a function in an optimized 64-bit application. The function is not inline, so we see both parameters and local variables.
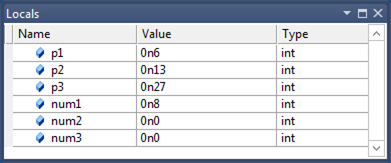
You can use the dv -v command to see the locations of the parameters and local variables.
Notice that the Locals window displays the parameters correctly even though they are stored in registers.
In addition to tracking variables with primitive types, the location records track data members of local structures and classes. The following debugger output displays local structures.
0:000> dt My1
Local var Type _LocalStruct
   +0x000 i1               : 0n0 (edi)
   +0x004 i2               : 0n1 (rsp+0x94)
   +0x008 i3               : 0n2 (rsp+0x90)
   +0x00c i4               : 0n3 (rsp+0x208)
   +0x010 i5               : 0n4 (r10d)
   +0x014 i6               : 0n7 (rsp+0x200)

0:000> dt My2
Local var @ 0xefa60 Type _IntSum
   +0x000 sum1             : 0n4760 (edx)
   +0x004 sum2             : 0n30772 (ecx)
   +0x008 sum3             : 0n2 (r12d)
   +0x00c sum4             : 0n0
Here are some observations about the preceding debugger output.
- The local structure My1 illustrates that the compiler can spread local structure data members to registers and non-contiguous stack slots.
- The output of the command dt My2 will be different from the output of the command dt _IntSum 0xefa60. You cannot assume that the local structure will occupy a contiguous block of stack memory. In the case of My2, only
sum4stays in the original stack block; the other three data members are moved to registers. - Some data members can have multiple locations. For example, My2.sum2 has two locations: one is register ECX (which the Windows debugger chooses) and the other is 0xefa60+0x4 (the original stack slot). This could happen for primitive-type local variables also, and the Windows debugger imposes precedent heuristics to determine which location to use. For example, register locations always trump stack locations.
Display of inline functions on the call stack
During code optimization, some functions are placed in line. That is, the body of the function is placed directly in the code like a macro expansion. There is no function call and no return to the caller. To facilitate the display of inline functions, the compiler stores data in the PDB files that helps decode the code chunks for the inline functions (that is, sequences of code blocks in caller functions that belong to the callee functions that are being placed inline) as well as the local variables (scoped local variables in those code blocks). This data helps the debugger include inline functions as part of the stack unwind.
Suppose you compile an application and force a function named func1 to be inline.
__forceinline int func1(int p1, int p2, int p3)
{
   int num1 = 0;
   int num2 = 0;
   int num3 = 0;
   ...
}
You can use the bm command to set a breakpoint at func1.
0:000> bm MyApp!func1
  1: 000007f6`8d621088 @!"MyApp!func1" (MyApp!func1 inlined in MyApp!main+0x88)
0:000> g

Breakpoint 1 hit
MyApp!main+0x88:
000007f6`8d621088 488d0d21110000  lea     rcx,[MyApp!`string' (000007f6`8d6221b0)]
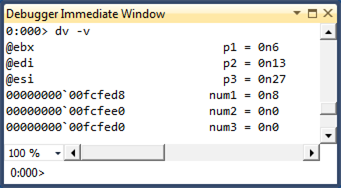
After you take one step into func1, you can use the k command to see func1 on the call stack. You can use the dv command to see the local variables for func1. Notice that the local variable num3 is shown as unavailable. A local variable can be unavailable in optimized code for a number of reasons. It might be that the variable doesn't exist in the optimized code. It might be that the variable has not been initialized yet or that the variable is no longer being used.
0:000> p
MyApp!func1+0x7:
000007f6`8d62108f 8d3c33          lea     edi,[rbx+rsi]

0:000> knL
# Child-SP          RetAddr           Call Site
00 (Inline Function) --------`-------- MyApp!func1+0x7
01 00000000`0050fc90 000007f6`8d6213f3 MyApp!main+0x8f
02 00000000`0050fcf0 000007ff`c6af0f7d MyApp!__tmainCRTStartup+0x10f
03 00000000`0050fd20 000007ff`c7063d6d KERNEL32!BaseThreadInitThunk+0xd
04 00000000`0050fd50 00000000`00000000 ntdll!RtlUserThreadStart+0x1d

0:000> dv -v
00000000`0050fcb0            num1 = 0n0
00000000`0050fcb4            num2 = 0n0
<unavailable>                num3 = <value unavailable>
If you look at frame 1 in the stack trace, you can see the local variables for the main function. Notice that two of the variables are stored in registers.
0:000> .frame 1
01 00000000`0050fc90 000007f6`8d6213f3 MyApp!main+0x8f

0:000> dv -v
00000000`0050fd08               c = 0n7
@ebx                            b = 0n13
@esi                            a = 0n6
The Windows debugger aggregates data from PDB files to find all the places where a specific function has been placed inline. You can use the x command to list all the caller sites of the an inline function.
0:000> x simple!MoreCalculate
00000000`ff6e1455 simple!MoreCalculate =  (inline caller) simple!wmain+8d
00000000`ff6e1528 simple!MoreCalculate =  (inline caller) simple!wmain+160

0:000> x simple!Calculate
00000000`ff6e141b simple!Calculate =  (inline caller) simple!wmain+53
Because the Windows debugger can enumerate all the caller sites of an inline function, it can set a breakpoints inside the inline function by calculating the offsets from the caller sites. You can use the bm command (which is used to set breakpoints that match regular expression patterns) to set breakpoints for inline functions.
The Windows debugger groups all breakpoints that are set for a specific inline function into a breakpoint container. You can manipulate the breakpoint container as a whole by using commands like be, bd, bc. See the following bd 3 and bc 3 command examples. You can also manipulate individual breakpoints. See the following be 2 command example.
0:000> bm simple!MoreCalculate
  2: 00000000`ff6e1455 @!"simple!MoreCalculate" (simple!MoreCalculate inlined in simple!wmain+0x8d)
  4: 00000000`ff6e1528 @!"simple!MoreCalculate" (simple!MoreCalculate inlined in simple!wmain+0x160)

0:000> bl
 0 e 00000000`ff6e13c8 [n:\win7\simple\simple.cpp @ 52]    0001 (0001)  0:**** simple!wmain
 3 e <inline function>     0001 (0001)  0:**** {simple!MoreCalculate}
     2 e 00000000`ff6e1455 [n:\win7\simple\simple.cpp @ 58]    0001 (0001)  0:**** simple!wmain+0x8d (inline function simple!MoreCalculate)
     4 e 00000000`ff6e1528 [n:\win7\simple\simple.cpp @ 72]    0001 (0001)  0:**** simple!wmain+0x160 (inline function simple!MoreCalculate)

0:000> bd 3
0:000> be 2

0:000> bl
 0 e 00000000`ff6e13c8 [n:\win7\simple\simple.cpp @ 52]    0001 (0001)  0:**** simple!wmain
 3 d <inline function>     0001 (0001)  0:**** {simple!MoreCalculate}
     2 e 00000000`ff6e1455 [n:\win7\simple\simple.cpp @ 58]    0001 (0001)  0:**** simple!wmain+0x8d (inline function simple!MoreCalculate)
     4 d 00000000`ff6e1528 [n:\win7\simple\simple.cpp @ 72]    0001 (0001)  0:**** simple!wmain+0x160 (inline function simple!MoreCalculate)

0:000> bc 3

0:000> bl
 0 e 00000000`ff6e13c8 [n:\win7\simple\simple.cpp @ 52]    0001 (0001)  0:**** simple!wmain
Because there are no explicit call or return instructions for inline functions, source-level stepping is especially challenging for a debugger. For example, you could unintentionally step in to an inline function (if the next instruction is part of an inline function), or you could step in and step out of the same inline function multiple times (because the code blocks for the inline function have been split and moved by the compiler). To preserve the familiar stepping experience, the Windows debugger maintains a small conceptual call stack for every code instruction address and builds an internal state machine to execute step-in, step-over, and step-out operations. This gives a reasonably accurate approximation to the stepping experience for non-inline functions.
南来地,北往的,上班的,下岗的,走过路过不要错过!
======================个性签名=====================
之前认为Apple 的iOS 设计的要比 Android 稳定,我错了吗?
下载的许多客户端程序/游戏程序,经常会Crash,是程序写的不好(内存泄漏?刚启动也会吗?)还是iOS本身的不稳定!!!
如果在Android手机中可以简单联接到ddms,就可以查看系统log,很容易看到程序为什么出错,在iPhone中如何得知呢?试试Organizer吧,分析一下Device logs,也许有用.


