
硬件断点


JIT Debugging in Session 0
The native JIT debugger is started in the same user session as the process that’s about to crash. For the system and user-provided service processes that run in the noninteractive system session (ses- sion 0), in particular, the JIT debugger process from the AeDebug registry key also gets started in that same session, meaning that you will not be able to interact with that new debugger instance when it attaches to the target process. You won’t get any visual cues to let you know that a crash is actually in progress, either, and you might totally miss the crash if JIT debugging is enabled on the machine.
If you’re simply trying to use JIT debugging to investigate a known crash, however, there is good news despite the grim outlook of not being able to interact with the new JIT debugger. Remember from the architectural overview of WER’s support for JIT debugging that any user-mode process that’s about to crash waits for the new debugger instance specified in the AeDebug registry key
to attach to it before its execution proceeds forward and the process finally exits. This means that the debugger in the AeDebug registry key doesn’t really need to attach to the process and, in fact, doesn’t even need to be a true debugger. If you replace the Debugger value under the AeDebug
key with cmd.exe, for instance, you can block the execution of the target at the time of its crash and
attach to it as usual by using the F6 shortcut in windbg .exe right from your current user session. The
crash call site should be there waiting for you when you attach! Be sure, however, to list (tlist.exe) and
kill (kill.exe) any leaked cmd.exe instances that get automatically started by WER in session 0 at the
end of your experimentation.
The LocalDumps registry Key
The Windows Error Reporting (WER) framework in the OS supports an important registry key that allows you to request automatic crash-dump generation when user-mode processes hit unhandled exceptions. Because there are no tools to configure this key, you’ll need to edit the registry manually, though the companion source code contains a script to help automate this task.
For example, the following command, which you’ll need to execute from an elevated administrative command prompt, will configure your machine so that crash dumps are automatically captured for each process that crashes as a result of an unhandled exception.
C:\book\code\chapter_04\scripts>edit_local_dumps_key.cmd -df c:\dumps –dt 2
The first argument to this helper script is the folder location that WER should use when it generates its user-mode crash dumps, and the second argument specifies the type of those dump files. A value of 2 indicates that you would like WER to generate crash dumps with full memory infor- mation. Once this command is executed successfully, the LocalDumps registry key should look similar to Figure 4-13.
[HKEY_LOCAL_MACHINE\SOFTWARE\Microsoft\Windows\Windows Error Reporting\LocalDumps]
noninvasive Debugging
You can use noninvasive debugging to inspect a memory snapshot of the target process without fully attaching to it as a user-mode debugger. WinDbg supports this convenient feature, which can be useful when a second debugger—such as the Microsoft Visual Studio debugger—is already used to actively debug the target. In that case, you can attach an instance of WinDbg in noninvasive mode and inspect a snapshot of the process virtual memory, with all the power of the WinDbg debugging environment. Once you are done observing the target, you can then detach WinDbg and go back
to controlling it using the original debugger. This enables you to use WinDbg alongside the Visual Studio debugger and take advantage of their respective strengths at the same time.
In noninvasive debugging, the debugger doesn’t receive any debug events from the target process, so it can’t control it in this mode. Instead, the debugger simply suspends the threads in the target and executes the static debugger commands you enter, allowing you to inspect and modify the virtual address space of the target process. Commands used for tasks such as stack back-tracing (k* commands), inspecting register and memory values (dd, db, and so on), or modifying process memory (ed, eb, and so on) are all supported. You can even generate memory dumps for later analysis by using the .dump command. What the debugger isn’t able to do is actively control the target in this mode, so you won’t be able to set breakpoints or let the target continue its execution. In this sense, the noninvasive form of user-mode debugging is similar to the live form of kernel-mode debugging introduced back in Chapter 2, “Getting Started,” only the target machine isn’t frozen in the case of live kernel debugging.
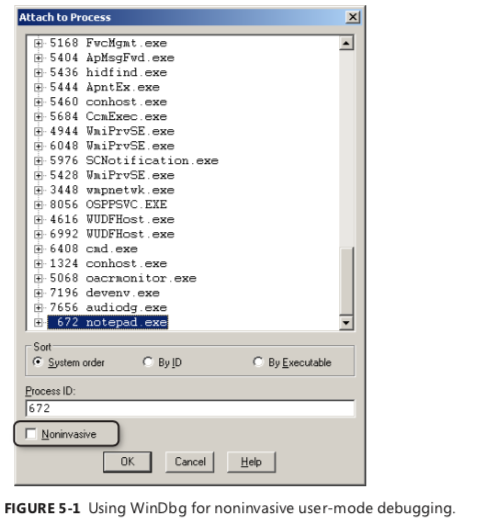
A noninvasive debugging session can be started by using the Attach To Process menu action in the windbg .exe user interface (UI) (the F6 shortcut) and selecting the Noninvasive option at the bottom
of the Attach dialog box, as shown in Figure 5-1. Alternatively, you can use the –pv command-line
option of WinDbg to achieve the same goal (as you’ll shortly see in this section).
Deep Inside User-Mode and Kernel-Mode Data Breakpoints
In the previous examples, you might have noticed that you had to advance to the main entry point of the program first before you could add your data breakpoints. As it turns out, the debugger won’t allow you to insert such breakpoints during the post-process initialization breakpoint that you see when you first execute a process under the WinDbg user-mode debugger, as demonstrated in the following listing.
0:000> vercommand
command line: '"c:\Program Files\Debugging Tools for Windows (x86)\windbg.exe" notepad'
0:000> .symfix
0:000> .reload
0:000> x ntdll!*tobreak*
76fbd968 ntdll!g_dwLastErrorToBreakOn = <no type information>
0:000> ba r4 76fbd968
^ Unable to set breakpoint error
The system resets thread contexts after the process
breakpoint so hardware breakpoints cannot be set.
Go to the executable's entry point and set it then.
'ba r4 76fbd968'
0:000> q
So, why is the debugger talking about thread contexts or hardware breakpoints here? To understand this, you need to go deeper and learn how data breakpoints are internally implemented by the system. Unlike code breakpoints, which are implemented in software by modifying the target
memory in-place and inserting the int 3 debug break instruction (as you saw in Chapter 3, “How Windows Debuggers Work”), data breakpoints do not change the code in memory and instead use dedicated CPU debug registers to implement their functionality. This is why data breakpoints are also called hardware breakpoints.
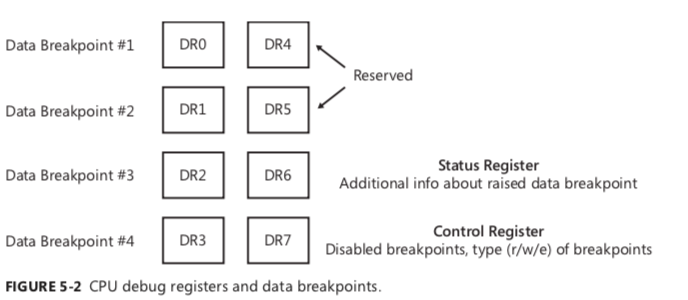
Both the x86 and x64 families of processors have eight debug registers, named DR0, DR1, and so on, through DR7. However, only the first four registers can be used for storing the memory location (virtual address) of a data breakpoint. DR4 and DR5 are reserved registers. The DR6 and DR7 registers deserve more explanation because, though they aren’t used to directly hold data breakpoints, they’re used to help track the breakpoints set using the first four debug registers. More specifically, DR6 is
a status register whose bits are context-dependent and provide the debuggers with more informa-
tion about certain exceptions. For example, the single-step bit mask (0x4000) is used to determine
whether the received debug event is raised in response to a single-step exception or a data break-
point because they are both raised with the STATUS_SINGLE_STEP Structured Exception Handling
(SEH) exception code. DR6 also contains other bits to indicate which one of the four possible data
breakpoints was hit, which is precisely why the DR6 register is called the debug status register. Finally,
DR7 is called the debug control register and is used to track global information about the CPU data
breakpoints, including whether the breakpoints stored in DR0, DR1, DR2, and DR3 are enabled or
disabled and also the type (read/write or execute) of each of the four breakpoints. Figure 5-2 recaps
the available debug registers and their respective roles.
Be aware that the CPU debug registers (as well as other registers) are saved as part of the user-mode thread context so that when the thread is switched onto the CPU for execution, the values saved in its thread context are loaded into the physical CPU registers, providing the thread with the same context it had when its execution was preempted earlier by the operating system.
When a data breakpoint is set inside a user-mode debugger in particular, the debugger enumerates all the threads inside the target process and calls the kernel32!SetThreadContext Win32 function for each one of them to set the appropriate DR register values. Data breakpoints set inside a kernel-mode debugger are implemented similarly, except they get saved in a special field of the processor control block (PRCB)—a structure used by the operating system to store per-processor information—so that they also can get applied to new threads created on the target machine.
This explains why data breakpoints applied inside a user-mode debugger are visible only in that particular debugging session despite the fact that the debug registers are global (per CPU). Because the thread contexts in other user-mode processes won’t be affected by the data breakpoints inserted in other user-mode debugging sessions, those breakpoints will be visible only when the CPU switches to the threads of the target process in those sessions. This results in exactly the behavior you would expect—namely, that data breakpoints from a user-mode debugger are visible only within the target process in that debugging session.
In addition, data breakpoints defined inside a user-mode debugger do not interfere with those defined in the kernel-mode debugger. The user-mode debugger always resets the contexts of the threads in its target process, so data breakpoints defined inside the kernel-mode debugger are never seen in any user-mode debugger instances on the target machine. This explains why the debugger didn’t let you set data breakpoints during the early NTDLL post-process initialization breakpoint, because they would end up being cleared by the user-mode debugger.
南来地,北往的,上班的,下岗的,走过路过不要错过!
======================个性签名=====================
之前认为Apple 的iOS 设计的要比 Android 稳定,我错了吗?
下载的许多客户端程序/游戏程序,经常会Crash,是程序写的不好(内存泄漏?刚启动也会吗?)还是iOS本身的不稳定!!!
如果在Android手机中可以简单联接到ddms,就可以查看系统log,很容易看到程序为什么出错,在iPhone中如何得知呢?试试Organizer吧,分析一下Device logs,也许有用.


