
Using Dump Files
This article applies to Visual Studio 2015. If you're looking for the latest Visual Studio documentation, see Visual Studio documentation. We recommend upgrading to the latest version of Visual Studio. Download it here
Dump files with or without heaps; create a dump file; open a dump file; find the binaries, pdbs, and source file for a dump file.
Contents
Dump files, with or without heaps
Find binaries, symbol (.pdb) files, and source files
What is a dump file?
A dump file is a snapshot of an app at the point in time the dump is taken. It shows what process was executing and what modules were loaded. If the dump was saved with heap information, the dump file contains a snapshot of what was in the app's memory at that point in time. Opening a dump file with a heap in Visual Studio is like stopping at a breakpoint in a debug session. Although you cannot continue execution, you can examine the stacks, threads, and variable values of the app at the time the dump occurred.
Dumps are primarily used for debugging issues that occur on machines that the developer doesn’t have access to. For example, you can use a dump file from a customer's machine when you can’t reproduce the customer's crash or unresponsive program on your machine. Dumps are also created by testers to save crash or unresponsive program data so that the test machine can be used for more testing. The Visual Studio debugger can save dump files for managed or native code. The debugger can load dump files that were created by Visual Studio or by other programs that save files in the minidump format.
Dump files, with or without heaps
You can create dump files with or without heap information.
-
Dump files with heaps contain a snapshot of the app's memory. This includes the values of variables at the time the dump was created. If you load a dump file that was saved with a heap, Visual Studio can load the symbols even if the application binary is not found. Visual Studio also saves the binaries of loaded native modules in the dump file, which can make debugging much easier.
-
Dump files without heaps are much smaller than dumps with heap information. However, the debugger has to load the app binaries to find the symbol information. The binaries must be an exact match of the binaries that were used when the dump was created. Only the values of stack variables are saved in dump files without heap data.
Requirements and limitations
-
Debugging dump files of optimized code can be confusing. For example, compiler inlining of functions can result in unexpected call stacks and other optimizations might change the lifetime of variables.
-
Dump files from 64-bit machines must be debugged on an instance of Visual Studio that is running on a 64-bit computer.
-
In versions of Visual Studio before VS 2013, dumps of 32-bit apps that were run on 64-bit machines that were collected by some tools (such as Task Manager and 64-bit WinDbg) could not be opened in Visual Studio. This limitation has been removed in VS 2013.
-
Visual Studio can debug dump files of native apps from ARM devices. Visual Studio can also debug apps dump files of managed apps from ARM devices, but only in the native debugger.
-
To debug kernel-mode dump files in Visual Studio 2013, download the Windows 8.1 Version of Debugging Tools for Windows. See Kernel Debugging in Visual Studio.
-
Visual Studio can't debug dump files saved in the older dump format known as a full user-mode dump. Note that a full user-mode dump is not the same a dump with heap.
-
To debug with the SOS.dll (SOS Debugging Extension) in Visual Studio, you must install the Debugging Tools for Windows that is part of the Windows Driver Kit (WDK). See Windows 8.1 Preview: Download kits, bits, and tools.
Create a dump file
To create a dump file with Visual Studio:
-
While you are debugging a process in Visual Studio, you can save a dump file when the debugger has stopped at an exception or at a breakpoint. Choose Save Dump As, Debug. In the Save Dump As dialog box, in the Save as type list, you can select Minidump or Minidump with Heap (the default).
-
With Just-In-Time Debugging enabled, you can attach the debugger to a crashed process that is running outside the debugger, and then save a dump file. See Attach to Running Processes
You can also create dump files with any program that supports the Windows minidump format. For example, the Procdump command-line utility from Windows Sysinternals can create process crash dump files based on triggers or on-demand. See Requirements and limitations in this topic for additional information about using other tools to create dump files.
Open a dump file
-
In Visual Studio, choose File, Open, File.
-
In the Open File dialog box, locate and select the dump file. It will usually have a .dmp extension. Then choose OK.
-
The Dump File Summary window appears. In this window, you can view debugging summary information for the dump file, set the symbol path, start debugging, and copy the summary information to the clipboard.

-
To start debugging, go to the Actions section, and choose either Debug with Native Only or Debug with Mixed.
Find binaries, symbol (.pdb) files, and source files
To use the full features of Visual Studio to debug a dump file, you need access to:
-
The .exe file for which the dump was taken and other binaries (DLLs, etc.) that were used in the dump process.
If you are debugging a dump with heap data, Visual Studio can cope with missing binaries for some modules, but it must have binaries for enough modules to generate valid call stacks. Visual Studio includes the native modules in a dump file with heap.
-
Symbol (.pdb) files for the .exe and other binaries.
-
Source files for the modules that you are interested in.
The executable and the .pdb files must match exactly the version and build of the files used when the dump was created.
You can debug using the disassembly of the modules if you can’t find the source files,
Default search paths for executable files
Visual Studio automatically searches these locations for executable files that aren’t included in the dump file:
-
The directory that contains the dump file.
-
The path of the module that is specified in the dump file. This is the module path on the machine where the dump was collected.
-
The symbol paths specified in the Debugging, Options, Symbols page of the Visual Studio Tools, Options dialog box. You can add more locations to search on this page.
Using the No Binary / Symbol / Source pages
If Visual Studio can’t find the files needed to debug a module in the dump, it displays an appropriate page (No Binary Found, No Symbols Found, or No Source Found). These pages provide detailed information about the cause of the issue and provide action links that can help you identify the correct location of the files. See Specify Symbol (.pdb) and Source Files.
See Also
Just-In-Time Debugging
Specify Symbol (.pdb) and Source Files
Overview of memory dump file options for Window
Applies to: Windows 7 Service Pack 1, Windows Server 2012 R2
Summary
You can configure the following operating systems to write debugging information:
- Windows 7
- Windows Server 2012 R2
The debugging information can be written to different file formats (also known as memory dump files) when your computer stops unexpectedly because of a Stop error (also known as a blue screen, system crash, or bug check). You can also configure Windows not to write debugging information to a memory dump file.
Windows can generate any one of the following memory dump file types:
- Complete memory dump
- Kernel memory dump
- Small memory dump (64 KB)
- Automatic memory dump
Complete memory dump
A complete memory dump records all the contents of system memory when your computer stops unexpectedly. A complete memory dump may contain data from processes that were running when the memory dump was collected.
If you select the Complete memory dump option, you must have a paging file on the boot volume that is sufficient to hold all the physical RAM plus 1 megabyte (MB).
If the following conditions are true, the previous file is overwritten.
- A second problem occurs.
- Another complete memory dump (or kernel memory dump) file is created.
Note
- In Windows 7, the paging file can be on a partition that differs from the partition on which the operating system is installed.
- In Windows 7, you do not have to use the DedicatedDumpFile registry entry to put a paging file onto another partition.
- The Complete memory dump option is not available on computers that are running a 32-bit operating system and that have 2 gigabytes (GB) or more of RAM. For more information, see Specify what happens when the system stops unexpectedly.
Kernel memory dump
A kernel memory dump records only the kernel memory. It speeds up the process of recording information in a log when your computer stops unexpectedly. You must have a pagefile large enough to accommodate your kernel memory. For 32-bit systems, kernel memory is usually between 150 MB and 2 GB.
This dump file doesn't include unallocated memory or any memory that's allocated to User-mode programs. It includes:
- Memory that's allocated to the kernel and hardware abstraction layer (HAL) in Windows 2000 and later.
- Memory that's allocated to Kernel-mode drivers and other Kernel-mode programs.
For most purposes, this dump file is the most useful. It's smaller than the complete memory dump file. But it omits only those parts of memory that are unlikely to have been involved in the problem.
If the following conditions are true, the previous file is overwritten when the Overwrite any existing file setting is checked.
- A second problem occurs.
- Another kernel memory dump file (or a complete memory dump file) is created.
Small memory dump
A small memory dump records the smallest set of useful information that may help identify why your computer stopped unexpectedly. This option requires a paging file of at least 2 MB on the boot volume and specifies that Windows 2000 and later create a new file every time your computer stops unexpectedly. A history of these files is stored in a folder.
This dump file type includes the following information:
- The Stop message and its parameters and other data
- A list of loaded drivers
- The processor context (PRCB) for the processor that stopped
- The process information and kernel context (EPROCESS) for the process that stopped
- The process information and kernel context (ETHREAD) for the thread that stopped
- The Kernel-mode call stack for the thread that stopped
This kind of dump file can be useful when space is limited. However, because of the limited information included, errors that were not directly caused by the thread that was running at the time of the problem may not be discovered by an analysis of this file.
If the following conditions are true, the previous file is preserved.
- A second problem occurs.
- A second small memory dump file is created.
Each additional file is given a distinct name. The date is encoded in the file name. For example, Mini022900-01.dmp is the first memory dump generated on February 29, 2000. A list of all small memory dump files is kept in the %SystemRoot%\Minidump folder.
ProcDump v11.0 作者:Mark Russinovich 和 Andrew Richards
 下载 ProcDump (714 KB) https://files.cnblogs.com/files/ioriwellings/Procdump.zip
- Windows系统的任务管理器里抓dump
- 使用Debug Diagnostic Tool(DebugDiag)工具获取dump文件 可以fulldump
- 在命令行Windbg.exe -I 设置为默认调试工具,会弹出Windbg窗口
- WinDbg\adplus.vbs(exe) -crash -pn qq.exe -o c:\1.dmp , .dump /mfF c:\1.dump
- Visual Studio 切换到中断调试状态,在调试菜单下【将转储另存为】 弹出文件框,附带堆信息的小型转储
- 注册表 Windows Error Reporting
@echo off
echo 正在启用Dump...
reg add "HKEY_LOCAL_MACHINE\SOFTWARE\Microsoft\Windows\Windows Error Reporting\LocalDumps"
reg add "HKEY_LOCAL_MACHINE\SOFTWARE\Microsoft\Windows\Windows Error Reporting\LocalDumps" /v DumpFolder /t REG_EXPAND_SZ /d "C:\CrashDump" /f
reg add "HKEY_LOCAL_MACHINE\SOFTWARE\Microsoft\Windows\Windows Error Reporting\LocalDumps" /v DumpType /t REG_DWORD /d 2 /f
reg add "HKEY_LOCAL_MACHINE\SOFTWARE\Microsoft\Windows\Windows Error Reporting\LocalDumps" /v DumpCount /t REG_DWORD /d 10 /f
echo Dump已经启用
pause
@echo on

将上述内存保存为*.bat,然后执行,就开始了自动抓dmp文件的功能,只要有程序崩溃,就会在指定的目录下生成。

键值说明:

名称:DumpCount,类型:REG_DWORD,最大保留Dump个数,默认为10.
名称:DumpType,类型:REG_DWORD,Dump类型(1-Mini dump, 2-Full dump),默认为1.
名称:DumpFolder,类型:REG_EXPAND_SZ,Dump文件保存的位置。

当不需要自动抓取时,可以将下面的内容

@echo off
echo 正在关闭Dump...
reg delete "HKEY_LOCAL_MACHINE\SOFTWARE\Microsoft\Windows\Windows Error Reporting\LocalDumps" /f
echo Dump已经关闭
pause
@echo on

保存为bat执行,就不会在自动产生了
- 直接使用Windows的API——MiniDumpWriteDump和SetHandleExceptionFilter https://www.cnblogs.com/ioriwellings/p/16953759.htmlhttps://www.cnblogs.com/ioriwellings/p/16953794.html
- Process Explorer ,转药械工具APP时报 error configuring dump resources 系统找不到指定的文件
-
将 procdump 作为 AeDebug 的默认调试器
它的大概运作原理是:当程序出现了未处理异常,此时会激活操作系统的
Win32 unhandled exception filter,这个过滤器会调用注册表中HKLM\SOFTWARE\Microsoft\Windows NT\CurrentVersion\AeDebug节点配置的调试器,也就是我的 Procdump,要将 procdump 送到注册表的 AeDebug 节点,可以使用-i进行注册。-i Install ProcDump as the AeDebug postmortem debugger. Only -ma, -mp, -d and -r are supported as additional options.完整参考命令如下:
C:\Windows\system32>procdump -ma -i E:\test
ProcDump v10.0 - Sysinternals process dump utility
Copyright (C) 2009-2020 Mark Russinovich and Andrew Richards
Sysinternals - www.sysinternals.com
Set to:
  HKLM\SOFTWARE\Microsoft\Windows NT\CurrentVersion\AeDebug
    (REG_SZ) Auto     = 1
    (REG_SZ) Debugger = "C:\xcode\soft\Procdump\procdump.exe" -accepteula -ma -j "E:\test" %ld %ld %p
Set to:
  HKLM\SOFTWARE\Wow6432Node\Microsoft\Windows NT\CurrentVersion\AeDebug
    (REG_SZ) Auto     = 1
    (REG_SZ) Debugger = "C:\xcode\soft\Procdump\procdump.exe" -accepteula -ma -j "E:\test" %ld %ld %p
ProcDump is now set as the Just-in-time (AeDebug) debugger.
从输出信息看已经成功将其送入到注册表了,接下来可以打开
注册表编辑器去验证。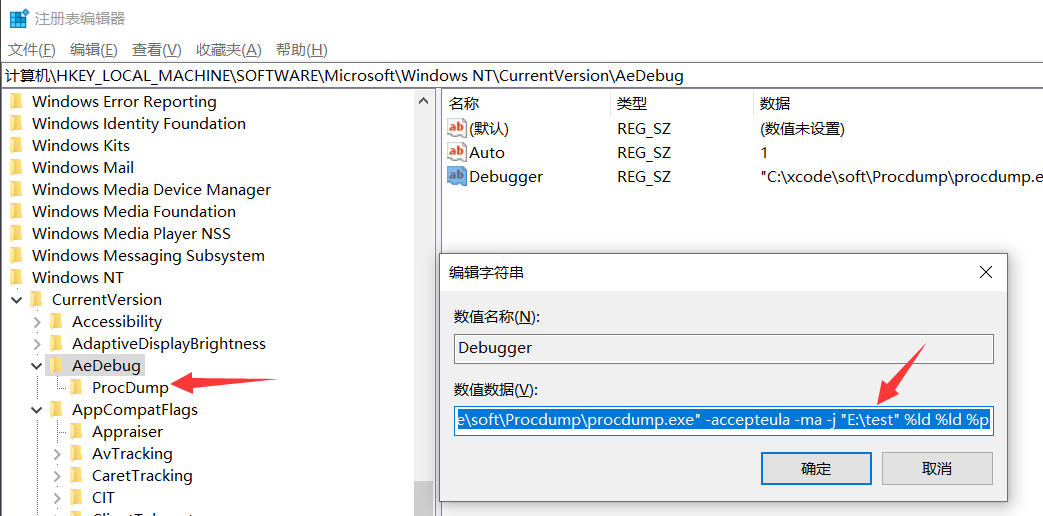
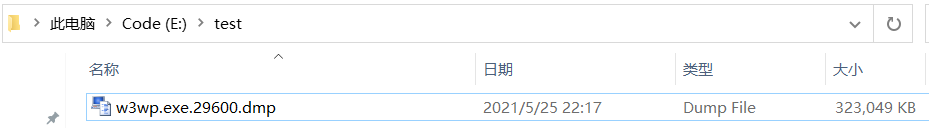
最后就是把 web 跑起来,1min之后就会成功的看到
E:\test下的 dump 文件啦,截图如下: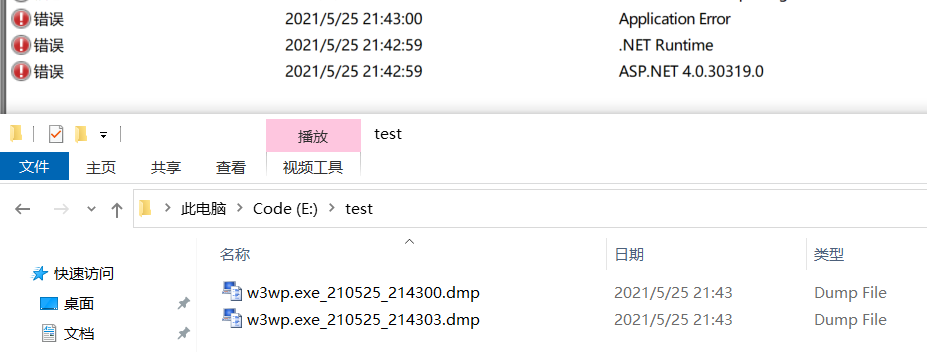
从图中看有2个dump,具体为什么是2个我就不管了,就怕不生成。😏😏😏
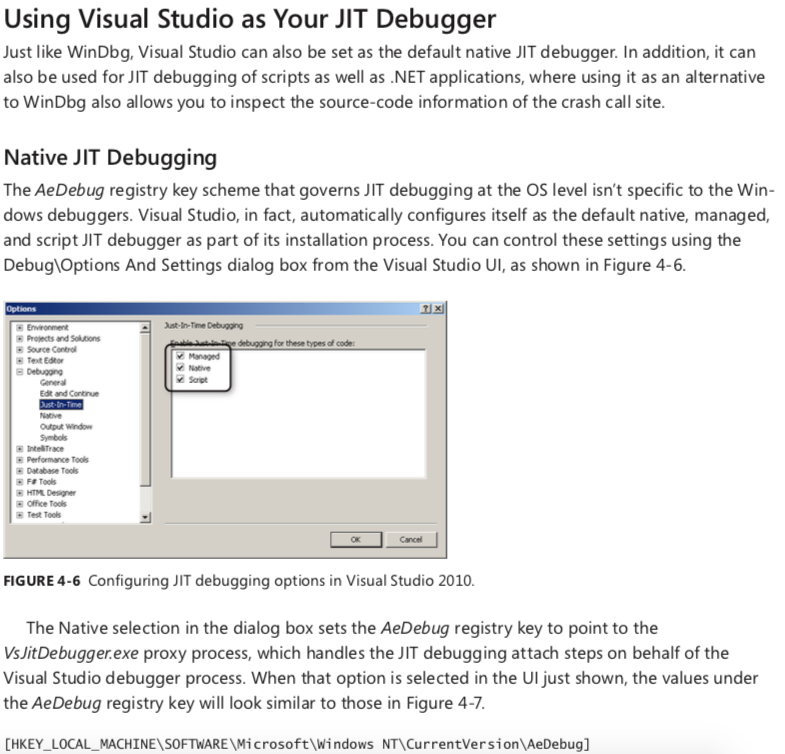
- Windbg AeDebug
To do so, first set WinDbg as your native JIT debugger on the system, which you can easily do
by using the /I command-line option of windbg .exe. This requires administrative privileges, so you
need to run this command from an elevated administrative command prompt for this registration
step to work successfully. In particular, make sure the dialog box message you see after running this
command says that it was successful, as highlighted in Figure 4-2.
C:\Program Files\Debugging Tools for Windows (x86)>windbg.exe /I
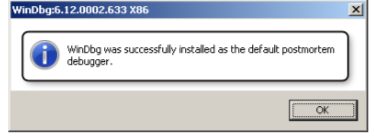
fIguRE 4-2 Setting WinDbg as the default native JIT debugger.
This registration step populates the AeDebug registry key shown in Figure 4-3, so another way to verify that the previous command was successful is to check the values in effect under that registry key and make sure they look similar to those in that screen shot.
[HKEY_LOCAL_MACHINE\SOFTWARE\Microsoft\Windows NT\CurrentVersion\AeDebug]
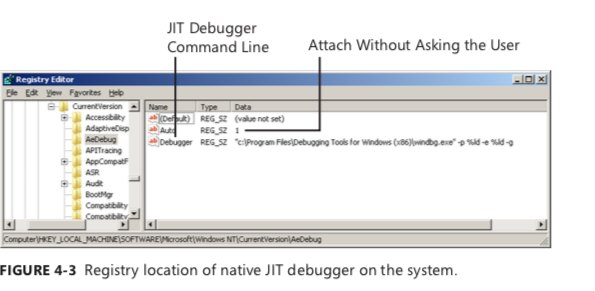
Now that the WinDbg debugger is configured as your default JIT debugger, you can run the crashing scenario again and see that you automatically break into a new WinDbg instance at the exact source/assembly line where the program crashes. Notice in particular that the CPU instruction at the
time of the crash was an attempt to move the value 5 to the NULL address stored in the eax register. The k debugger command also shows the source line of the faulting instruction in this case.
(14ec.f80): Access violation - code c0000005 (!!! second chance !!!) eax=00000000 ebx=00000000 ecx=00222378 edx=00000000 esi=00000001 edi=00222378
eip=002211ee esp=000cfca8 ebp=000cfcf0 iopl=0
cs=001b ss=0023 ds=0023 es=0023 fs=003b gs=0000
NullDereference!wmain+0x9:
002211ee c60005 mov byte ptr [eax],5
0:000> k
ChildEBP RetAddr
000cfcac 00221364 NullDereference!wmain+0x9 [c:\book\code\chapter_04\nulldereference\main.cpp @ 9]
000cfcf0 7689ed6c NullDereference!__wmainCRTStartup+0x102
000cfcfc 77b637f5 kernel32!BaseThreadInitThunk+0x12
000cfd3c 77b637c8 ntdll!RtlInitializeExceptionChain+0xef
000cfd54 00000000 ntdll!RtlInitializeExceptionChain+0xc2
0:000> $ Conduct any further "live" debugging, then terminate the JIT debugging session 0:000> q
Notice that all you had to do to automate catching this bug was register WinDbg as the native
JIT debugger on the system (a one-time registration step) and run the scenario that was exhibiting the crash. The OS took care of the rest on your behalf, stopping exactly at the call site of the crash. This is very convenient, especially when you find yourself dealing with complex scenarios that require complicated setup steps and end up starting more than one process before eventually encountering a crash in one of them.
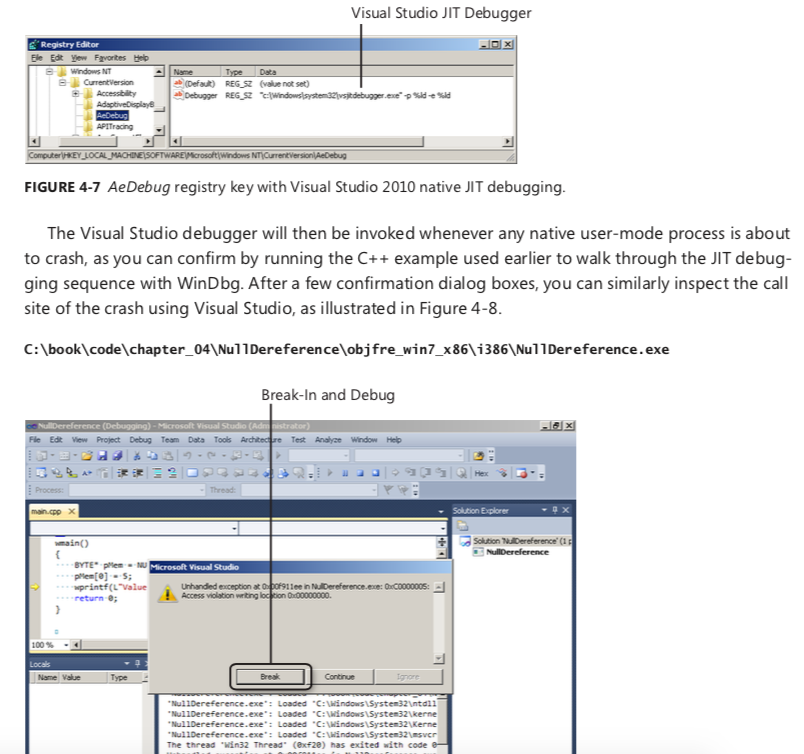
- Visual Studio JIT Debugger
-
3. 借助 Windows Error Reporting 生成
它的大概运作原理是借助 windows 自带的
Windows Error Reporting服务去帮助我们生成程序的 crash dump,要实现的话,必须开启这个服务并且在注册表中配置好你要抓取的exe程序,配置起来有点繁琐,这里有一个bat脚本,直接运行即可,简单粗暴。SET DMPPATH=E:\test SC CONFIG WerSvc START= AUTO NET START WerSvc ECHO 启用完成 REG DELETE HKEY_LOCAL_MACHINE\SOFTWARE\Microsoft\Windows NT\CurrentVersion\AeDebug\Debugger /f REG DELETE HKEY_LOCAL_MACHINE\SOFTWARE\Microsoft\.NETFramework\DbgManagedDebugger /f REG DELETE HKEY_LOCAL_MACHINE\SOFTWARE\Wow6432Node\Microsoft\Windows NT\CurrentVersion\AeDebug\Debugger /f REG DELETE HKEY_LOCAL_MACHINE\SOFTWARE\Wow6432Node\Microsoft\.NETFramework\DbgManagedDebugger /f ECHO 删除完成 REG ADD "HKEY_LOCAL_MACHINE\SOFTWARE\Microsoft\Windows\Windows Error Reporting\LocalDumps\w3wp.exe" /f REG ADD "HKEY_LOCAL_MACHINE\SOFTWARE\Microsoft\Windows\Windows Error Reporting\LocalDumps\w3wp.exe" /t REG_SZ /v DumpFolder /d %DMPPATH% /f REG ADD "HKEY_LOCAL_MACHINE\SOFTWARE\Microsoft\Windows\Windows Error Reporting\LocalDumps\w3wp.exe" /t REG_DWORD /v DumpCount /d 2 /f REG ADD "HKEY_LOCAL_MACHINE\SOFTWARE\Microsoft\Windows\Windows Error Reporting\LocalDumps\w3wp.exe" /t REG_DWORD /v DumpType /d 2 /f ECHO 启用完成 PAUSE有3个参数需要简单解释一下。
- DumpFolder: dump的存放路径
- DumpCount: 最多保留几个 dump 文件
- DumpType: 0:Custom dump. 1:Mini dump. 2:Full dump
bat执行完成后,可以到注册表中验证一下。
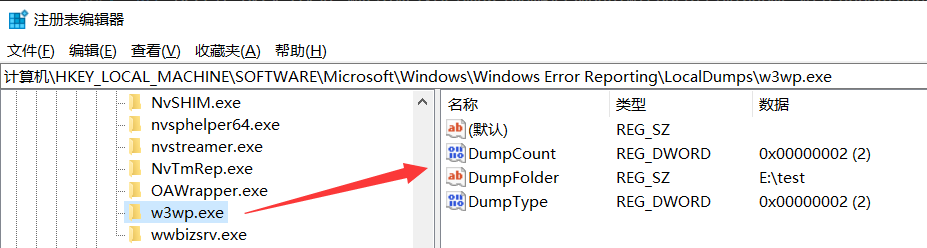
接下来把web跑起来,1min之后你就会看到生成的dump文件了,截图如下:
-
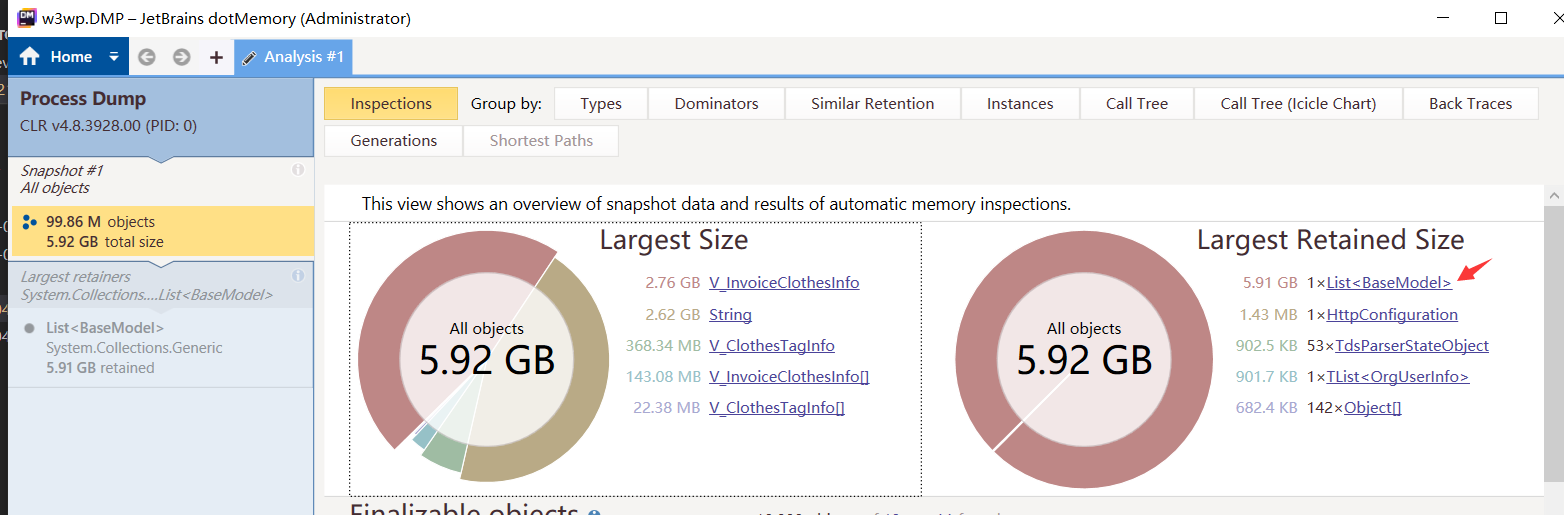
查看托管堆内存dump 软件:dotmemory
ProcDump v11.0
Published: 11/03/2022
 Download ProcDump (714 KB)
Download ProcDump for Linux (GitHub)
Created with ZoomIt
Introduction
ProcDump is a command-line utility whose primary purpose is monitoring an application for CPU spikes and generating crash dumps during a spike that an administrator or developer can use to determine the cause of the spike. ProcDump also includes hung window monitoring (using the same definition of a window hang that Windows and Task Manager use), unhandled exception monitoring and can generate dumps based on the values of system performance counters. It also can serve as a general process dump utility that you can embed in other scripts.
Using ProcDump
procdump.exe [-mm] [-ma] [-mt] [-mp] [-mc <Mask>] [-md <Callback_DLL>] [-mk]
            [-n <Count>]
            [-s <Seconds>]
            [-c|-cl <CPU_Usage> [-u]]
            [-m|-ml <Commit_Usage>]
            [-p|-pl <Counter> <Threshold>]
            [-h]
            [-e [1] [-g] [-b] [-ld] [-ud] [-ct] [-et]]
            [-l]
            [-t]
            [-f  <Include_Filter>, ...]
            [-fx <Exclude_Filter>, ...]
            [-dc <Comment>]
            [-o]
            [-r [1..5] [-a]]
            [-at <Timeout>]
            [-wer]
            [-64]
            {
                {{[-w] <Process_Name> | <Service_Name> | <PID>} [<Dump_File> | <Dump_Folder>]}
            |
                {-x <Dump_Folder> <Image_File> [Argument, ...]}
            }
Install Usage:
procdump.exe -i [Dump_Folder]
            [-mm] [-ma] [-mt] [-mp] [-mc <Mask>] [-md <Callback_DLL>] [-mk]
            [-r]
            [-at <Timeout>]
            [-k]
            [-wer]
Uninstall Usage:
procdump.exe -u
Dump Types:
| Dump Type | Description |
|---|---|
| -mm | Write a 'Mini' dump file. (default) - Includes directly and indirectly referenced memory (stacks and what they reference). - Includes all metadata (Process, Thread, Module, Handle, Address Space, etc.). |
| -ma | Write a 'Full' dump file. - Includes all memory (Image, Mapped and Private). - Includes all metadata (Process, Thread, Module, Handle, Address Space, etc.). |
| -mt | Write a 'Triage' dump file. - Includes directly referenced memory (stacks). - Includes limited metadata (Process, Thread, Module and Handle). - Removal of sensitive information is attempted but not guaranteed. |
| -mp | Write a 'MiniPlus' dump file. - Includes all Private memory and all Read/Write Image or Mapped memory. - Includes all metadata (Process, Thread, Module, Handle, Address Space, etc.). - To minimize size, the largest Private memory area over 512MB is excluded. A memory area is defined as the sum of same-sized memory allocations. The dump is as detailed as a Full dump but 10%-75% the size. - Note: CLR processes are dumped as Full (-ma) due to debugging limitations. |
| -mc | Write a 'Custom' dump file. - Includes the memory and metadata defined by the specified MINIDUMP_TYPE mask (Hex). |
| -md | Write a 'Callback' dump file. - Includes the memory defined by the MiniDumpWriteDump callback routine named MiniDumpCallbackRoutine of the specified DLL.- Includes all metadata (Process, Thread, Module, Handle, Address Space, etc.). |
| -mk | Also write a 'Kernel' dump file. - Includes the kernel stacks of the threads in the process. - OS doesn't support a kernel dump ( -mk) when using a clone (-r).- When using multiple dump sizes, a kernel dump is taken for each dump size. |
Conditions:
| Condition | Description |
|---|---|
| -a | Avoid outage. Requires -r. If the trigger will cause the target to suspend for a prolonged time due to an exceeded concurrent dump limit, the trigger will be skipped. |
| -at | Avoid outage at Timeout. Cancel the trigger's collection at N seconds. |
| -b | Treat debug breakpoints as exceptions (otherwise ignore them). |
| -c | CPU threshold above which to create a dump of the process. |
| -cl | CPU threshold below which to create a dump of the process. |
| -dc | Add the specified string to the generated Dump Comment. |
| -e | Write a dump when the process encounters an unhandled exception. Include the 1 to create dump on first chance exceptions.Add -ld to create a dump when a DLL (module) is loaded (filtering applies).Add -ud to create a dump when a DLL (module) is unloaded (filtering applies).Add -ct to create a dump when a thread is created.Add -et to create a dump when a thread exits. |
| -f | Filter (include) on the content of exceptions, debug logging and filename at DLL load/unload. Wildcards (*) are supported. |
| -fx | Filter (exclude) on the content of exceptions, debug logging and filename at DLL load/unload. Wildcards (*) are supported. |
| -g | Run as a native debugger in a managed process (no interop). |
| -h | Write dump if process has a hung window (does not respond to window messages for at least 5 seconds). |
| -k | Kill the process after cloning (-r), or at end of dump collection. |
| -l | Display the debug logging of the process. |
| -m | Memory commit threshold in MB at which to create a dump. |
| -ml | Trigger when memory commit drops below specified MB value. |
| -n | Number of dumps to write before exiting. |
| -o | Overwrite an existing dump file. |
| -p | Trigger when the Performance Counter is at, or exceeds, the specified Threshold. Some Counters and/or Instance Names can be case-sensitive. |
| -pl | Trigger when the Performance Counter falls below the specified Threshold. |
| -r | Dump using a clone. Concurrent limit is optional (default 1, max 5). OS doesn't support a kernel dump (-mk) when using a clone (-r). CAUTION: a high concurrency value may impact system performance.- Windows 7: Uses Reflection. OS doesn't support -e.- Windows 8.0: Uses Reflection. OS doesn't support -e.- Windows 8.1+: Uses PSS. All trigger types are supported. |
| -s | Consecutive seconds before dump is written (default is 10). |
| -t | Write a dump when the process terminates. |
| -u | Treat CPU usage relative to a single core (used with -c). |
| -v | DEBUG ONLY: Verbose output. |
| -w | Wait for the specified process to launch if it's not running. |
| -wer | Queue the (largest) dump to Windows Error Reporting. |
| -x | Launch the specified image with optional arguments. If it is a Store Application or Package, ProcDump will start on the next activation (only). |
| -y | HIDDEN: Store Application activation. |
| -64 | By default ProcDump will capture a 32-bit dump of a 32-bit process when running on 64-bit Windows. This option overrides to create a 64-bit dump. Only use for WOW64 subsystem debugging. |
License Agreement:
Use the -accepteula command line option to automatically accept the Sysinternals license agreement.
Automated Termination:
-cancel <Target Process PID>
Using this option or setting an event with the name ProcDump-<PID> is the same as typing Ctrl+C to gracefully terminate ProcDump. Graceful termination ensures the process is resumed if a capture is active. The cancellation applies to ALL ProcDump instances monitoring the process.
Filename:
Default dump filename: PROCESSNAME_YYMMDD_HHMMSS.dmp
The following substitutions are supported:
| Substitution | Explanation |
|---|---|
| PROCESSNAME | Process Name |
| PID | Process ID |
| EXCEPTIONCODE | Exception Code |
| YYMMDD | Year/Month/Day |
| HHMMSS | Hour/Minute/Second |
Examples
-
Write a mini dump of a process named 'notepad' (only one match can exist):
C:\>procdump notepad -
Write a Full dump of a process with PID '4572':
C:\>procdump -ma 4572 -
Write a Mini first, and then a Full dump of a process with PID '4572':
C:\>procdump -mm -ma 4572 -
Write 3 Mini dumps 5 seconds apart of a process named 'notepad':
C:\>procdump -n 3 -s 5 notepad -
Write up to 3 Mini dumps of a process named 'consume' when it exceeds 20% CPU usage for five seconds:
C:\>procdump -n 3 -s 5 -c 20 consume -
Write a Mini dump for a process named 'hang.exe' when one of its windows is unresponsive for more than 5 seconds:
C:\>procdump -h hang.exe -
Write a Full and Kernel dump for a process named 'hang.exe' when one of its windows is unresponsive for more than 5 seconds:
C:\>procdump -ma -mk -h hang.exe -
Write a Mini dump of a process named 'outlook' when total system CPU usage exceeds 20% for 10 seconds:
C:\>procdump outlook -s 10 -p "\Processor(_Total)\% Processor Time" 20 -
Write a Full dump of a process named 'outlook' when Outlook's handle count exceeds 10,000:
C:\>procdump -ma outlook -p "\Process(Outlook)\Handle Count" 10000 -
Write a Full dump of 'svchost' PID 1234, Instance #87, when the handle count exceeds 10,000:
C:\>procdump -ma 1234 -p "\Process(svchost#87)\Handle Count" 10000Note: Multiple Instance Counters
If there are multiple instances of the counter, you'll need to include the Name and/or Instance number.\Processor(NNN)\% Processor Time \Thermal Zone Information(<name>)\Temperature \Process(<name>[#NNN])\<counter>Older OSes require you to append the PID for
\Processcounters.\Process(<name>[_PID])\<counter>Tip: Use Performance Monitor to view the counters (esp. case sensitivity).
Tip: For\Process(*)based counters, use PowerShell to map a PID to its#NNN.Get-Counter -Counter "\Process(*)\ID Process" -
Write a Full dump for a 2nd chance exception:
C:\>procdump -ma -e w3wp.exe -
Write a Full dump for a 1st or 2nd chance exception:
C:\>procdump -ma -e 1 w3wp.exe -
Write a Full dump for a debug string message:
C:\>procdump -ma -l w3wp.exe -
Write up to 10 Full dumps of each 1st or 2nd chance exception of w3wp.exe:
C:\>procdump -ma -n 10 -e 1 w3wp.exe -
Write up to 10 Full dumps if an exception's code/name/msg contains '
NotFound':C:\>procdump -ma -n 10 -e 1 -f NotFound w3wp.exe -
Write up to 10 Full dumps if a debug string message contains '
NotFound':C:\>procdump -ma -n 10 -l -f NotFound w3wp.exe -
Wait for a process called 'notepad' (and monitor it for exceptions):
C:\>procdump -e -w notepad -
Launch a process called 'notepad' (and monitor it for exceptions):
C:\>procdump -e -x c:\dumps notepad -
Register for launch, and attempt to activate, a store 'application'. A new ProcDump instance will start when it is activated:
C:\>procdump -e -x c:\dumps Microsoft.BingMaps_8wekyb3d8bbwe!AppexMaps -
Register for launch of a store 'package'. A new ProcDump instance will start when it is (manually) activated:
C:\>procdump -e -x c:\dumps Microsoft.BingMaps_1.2.0.136_x64__8wekyb3d8bbwe -
Write a MiniPlus dump of the Microsoft Exchange Information Store when it has an unhandled exception:
C:\>procdump -mp -e store.exe -
Display without writing a dump, the exception codes/names of w3wp.exe:
C:\>procdump -e 1 -f "" w3wp.exe -
Windows 7/8.0; Use Reflection to reduce outage for 5 consecutive triggers:
C:\>procdump -r -ma -n 5 -s 15 wmplayer.exe -
Windows 8.1+; Use PSS to reduce outage for 5 concurrent triggers:
C:\>procdump -r 5 -ma -n 5 -s 15 wmplayer.exe -
Install ProcDump as the (AeDebug) postmortem debugger:
C:\>procdump -ma -i c:\dumps..or..
C:\Dumps>procdump -ma -i -
Uninstall ProcDump as the (AeDebug) postmortem debugger:
C:\>procdump -u
See a list of example command lines (the examples are listed above):
C:\>procdump -? -e南来地,北往的,上班的,下岗的,走过路过不要错过!
======================个性签名=====================
之前认为Apple 的iOS 设计的要比 Android 稳定,我错了吗?
下载的许多客户端程序/游戏程序,经常会Crash,是程序写的不好(内存泄漏?刚启动也会吗?)还是iOS本身的不稳定!!!
如果在Android手机中可以简单联接到ddms,就可以查看系统log,很容易看到程序为什么出错,在iPhone中如何得知呢?试试Organizer吧,分析一下Device logs,也许有用.


