
自学过程中看了无数教程,出了无数次BUG后整理出的自认最简洁的方法。
1 导入jar包
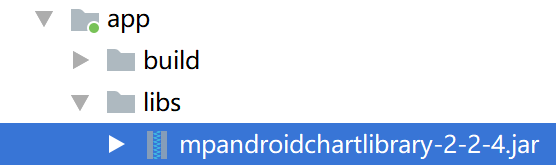
不知道是不是自己版本问题,网上那种直接implement的方法根本导入不了。索性直接引入mpandroidchartlibrary-2-2-4.jar并放在项目的libs文件夹下,右键选择add as library导入
2 主函数引用
import com.github.mikephil.charting.charts.PieChart;
import com.github.mikephil.charting.components.Legend;
import com.github.mikephil.charting.data.Entry;
import com.github.mikephil.charting.data.PieData;
import com.github.mikephil.charting.data.PieDataSet;

或者直接使用的时候ALT+Enter
3 XML布局
如果画折线图把里面的PieChart全部改成LineChart就行。
<?xml version="1.0" encoding="utf-8"?>
<LinearLayout xmlns:android="http://schemas.android.com/apk/res/android"
    xmlns:tools="http://schemas.android.com/tools"
    xmlns:app="http://schemas.android.com/apk/res-auto"
    android:layout_width="match_parent"
    android:layout_height="match_parent"
    android:background="@drawable/bg3"
    android:orientation="vertical">

    <com.github.mikephil.charting.charts.PieChart
        android:id="@+id/你的饼状图名"
        android:layout_width="match_parent"
        android:layout_height="180dp"
        android:layout_marginStart="8dp"
        android:layout_marginBottom="8dp"
        app:layout_constraintBottom_toBottomOf="parent"
        app:layout_constraintStart_toStartOf="parent">
    </com.github.mikephil.charting.charts.PieChart>


</LinearLayout>
4 画折线图
主要是通过LineDataSet和LineData对X、Y轴数据进行绑定 。ydata里存储需要画的数值,yvalues绑定ydata与横向坐标
ArrayList<String> xValues = new ArrayList<String>();
ArrayList<Float> ydata = new ArrayList<Float>();//y轴
ArrayList<Entry> yValues = new ArrayList<Entry>();
for (int i = 0; i < len; i++) {
    xValues.add("" + i);//横坐标标签
}
for(int i=0;i<len;i++){
    yValues.add(new Entry(ydata.get(i),i)); //横纵绑定,第i个
}
LineDataSet line1 = new LineDataSet(yValues, "各题难度");
LineData lineData = new LineData(xValues, line1);
lineChart.setData(lineData);
5 设置坐标轴自适应
网上这部分代码都好复杂……这里的想法是直接通过flag判断X轴坐标的个数来进行zoom伸缩,控制每次只显示固定个数点,这里是32个。//设置左右移动的个数 lineChart.setPinchZoom(true); lineChart.zoom(1,1,1,1); lineChart.getXAxis().setAxisMinValue(0f); if(xValues.size()>32){ lineChart.setPinchZoom(true); lineChart.zoom(2.5f,1,1,1); flag=1; } else{ flag=-1; }
6 其他的一些显示设置
上面二十多行代码可以画出最基本的折线图了,下面是一些进一步美化的属性。
       LineDataSet line1 = new LineDataSet(yValues, "图的标题");
        line1.setDrawValues(false);//不显示值
        line1.setLineWidth(1.75f); // 线宽
        line1.setCircleSize(2f);// 显示的圆形大小
        line1.setColor(Color.parseColor("#80c269"));// 曲线颜色
        line1.setCircleColor(Color.parseColor("#00561f"));// 圆形的颜色 深色
        line1.setHighLightColor(Color.parseColor("#80c269")); // 高亮的线的颜色
        line1.setHighlightLineWidth(0.75f);
        line1.setDrawCubic(true);
        line1.setDrawFilled(true);//就是折线图下面是否有阴影填充,这样看起来就像是起伏的山脉
        line1.setFillColor(Color.parseColor("#80c269"));

        lineChart.setDragEnabled(true);// 是否可以拖拽
        lineChart.setScaleEnabled(false);// 是否可以缩放
        lineChart.setTouchEnabled(true); // 设置是否可以触摸

        //lineChart.setDrawGridBackground(true); // 是否显示表格颜色
        //lineChart.setBackgroundColor(Color.parseColor("#c8ded0"));//设置背景
        lineChart.getAxisLeft().setDrawGridLines(false);//隐藏右边坐标轴横网格线

        lineChart.getAxisRight().setDrawGridLines(false);//隐藏X轴竖网格线
        lineChart.getXAxis().setDrawGridLines(false);
        lineChart.getXAxis().setPosition(XAxis.XAxisPosition.BOTTOM); // 让x轴在下面
        lineChart.getAxisRight().setEnabled(false); // 隐藏右边 的坐标轴
        lineChart.setDescription("");
 posted on

 浙公网安备 33010602011771号