主次坐标轴
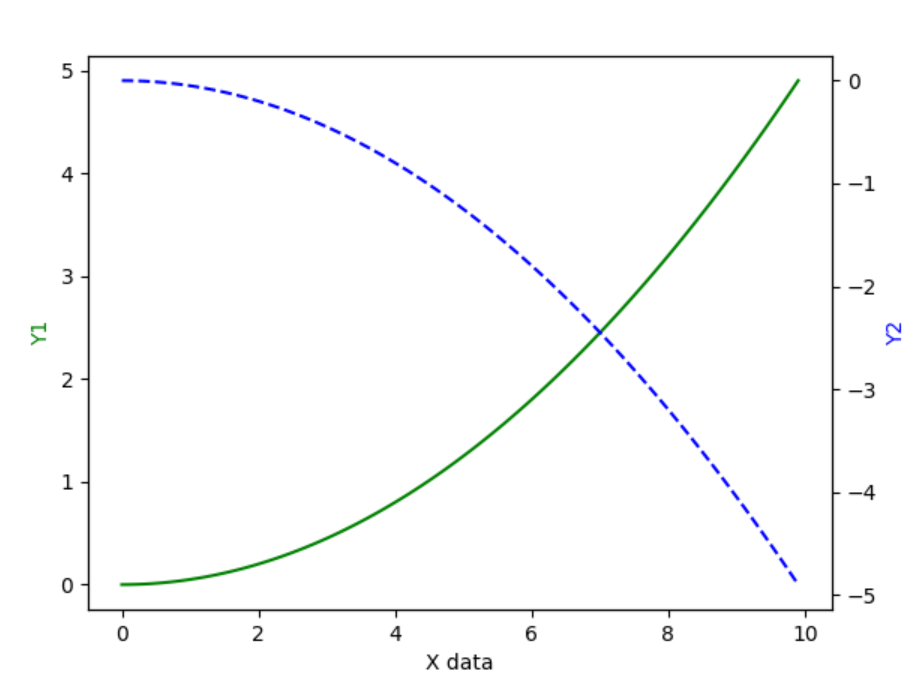
 1 import matplotlib.pyplot as plt
 2 import numpy as np
 3
 4 x = np.arange(0,10,0.1)
 5 y1 = 0.05*x**2
 6 y2 = -1*y1
 7
 8 fig,ax1 = plt.subplots()
 9 ax2 = ax1.twinx()
10 ax1.plot(x,y1,'g-')
11 ax2.plot(x,y2,'b--')
12
13 ax1.set_xlabel('X data')
14 ax1.set_ylabel('Y1',color='g')
15 ax2.set_ylabel('Y2',color='b')
16 plt.show()
运行结果: