图中图
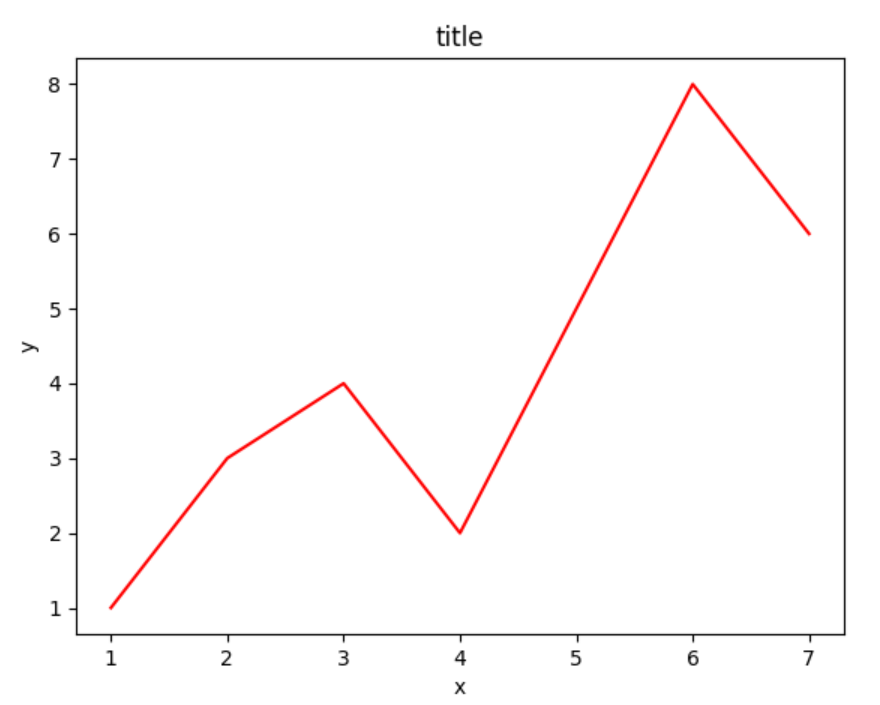
 1 import matplotlib.pyplot as plt
 2 import  matplotlib.gridspec as gridspec
 3
 4 fig = plt.figure()
 5 x = [1,2,3,4,5,6,7]
 6 y = [1,3,4,2,5,8,6]
 7
 8
 9 left,bottom,width,height = 0.1,0.1,0.8,0.8
10 ax1 = fig.add_axes([left,bottom,width,height])
11 ax1.plot(x,y,'r')
12 ax1.set_xlabel('x')
13 ax1.set_ylabel('y')
14 ax1.set_title('title')
15
16
17 plt.show()
运行结果:
1 import matplotlib.pyplot as plt 2
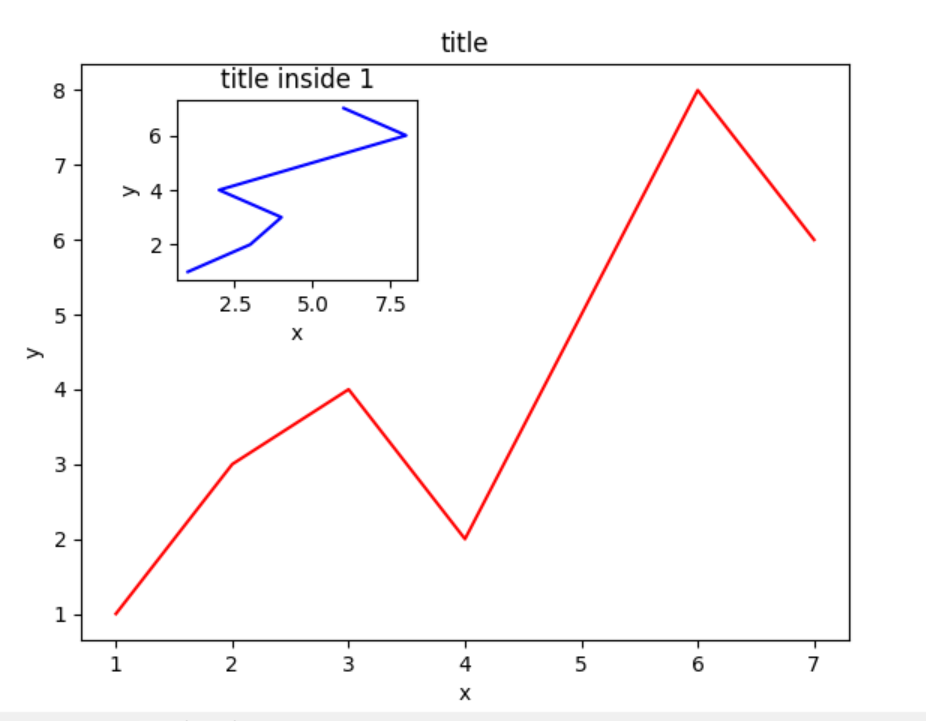
3 4 fig = plt.figure() 5 x = [1,2,3,4,5,6,7] 6 y = [1,3,4,2,5,8,6] 7 8 9 left,bottom,width,height = 0.1,0.1,0.8,0.8 #设定位置 10 ax1 = fig.add_axes([left,bottom,width,height]) 11 ax1.plot(x,y,'r') 12 ax1.set_xlabel('x') 13 ax1.set_ylabel('y') 14 ax1.set_title('title') 15 16 left,bottom,width,height = 0.2,0.6,0.25,0.25 #设定位置 17 ax2 = fig.add_axes([left,bottom,width,height]) 18 ax2.plot(y,x,'b') 19 ax2.set_xlabel('x') 20 ax2.set_ylabel('y') 21 ax2.set_title('title inside 1') 22 23 plt.show()
运行结果:
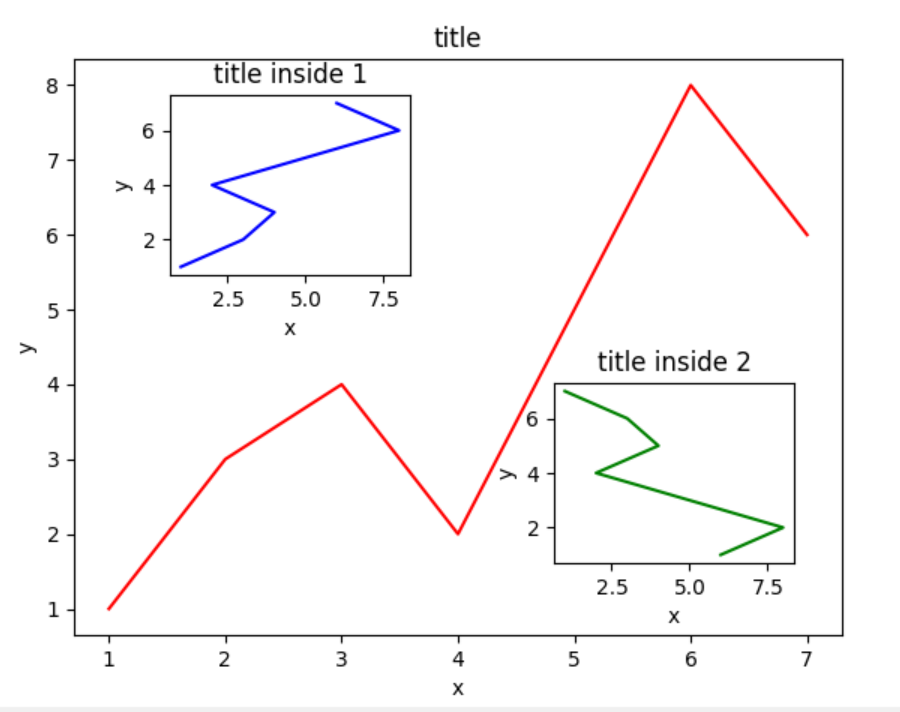
 1 import matplotlib.pyplot as plt
 2
 3
 4 fig = plt.figure()
 5 x = [1,2,3,4,5,6,7]
 6 y = [1,3,4,2,5,8,6]
 7
 8
 9 left,bottom,width,height = 0.1,0.1,0.8,0.8 #设定位置
10 ax1 = fig.add_axes([left,bottom,width,height])
11 ax1.plot(x,y,'r')
12 ax1.set_xlabel('x')
13 ax1.set_ylabel('y')
14 ax1.set_title('title')
15
16 left,bottom,width,height = 0.2,0.6,0.25,0.25 #设定位置
17 ax2 = fig.add_axes([left,bottom,width,height])
18 ax2.plot(y,x,'b')
19 ax2.set_xlabel('x')
20 ax2.set_ylabel('y')
21 ax2.set_title('title inside 1')
22
23 plt.axes([0.6,0.2,0.25,0.25])
24 plt.plot(y[::-1],x,'g')
25 plt.xlabel('x')
26 plt.ylabel('y')
27 plt.title('title inside 2')
28
29 plt.show()
运行结果: