Image 图片
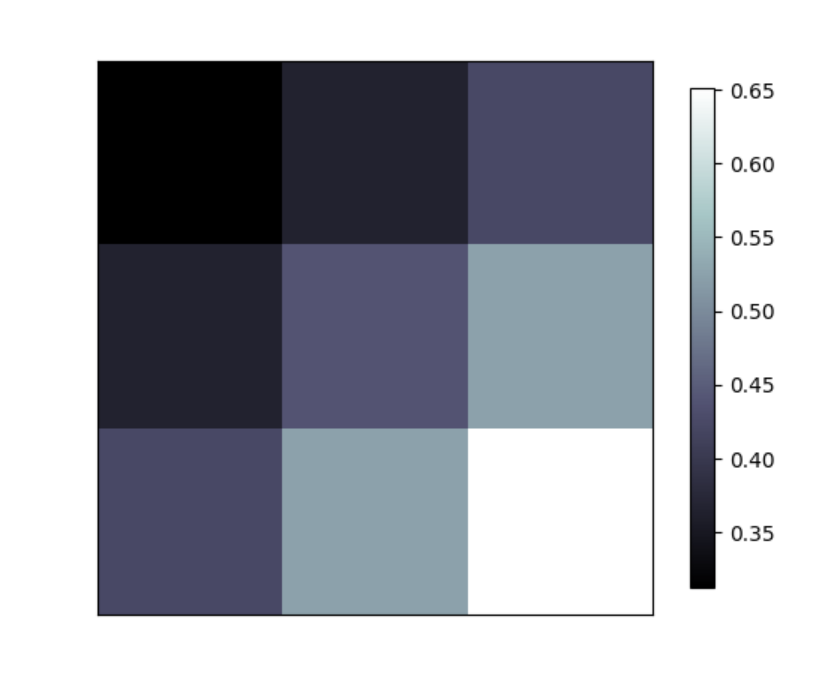
 1 import matplotlib.pyplot as plt
 2 import numpy as np
 3
 4 #image data
 5 a = np.array([0.313,0.365,0.423,
 6               0.365,0.439,0.525,
 7               0.423,0.525,0.651]).reshape(3,3)
 8
 9
10 plt.imshow(a,interpolation='nearest',cmap='bone',origin='upper')
11 plt.colorbar(shrink=0.9)
12
13
14 plt.xticks(())
15 plt.yticks(())
16 plt.show()
运行结果如下: