等高线图
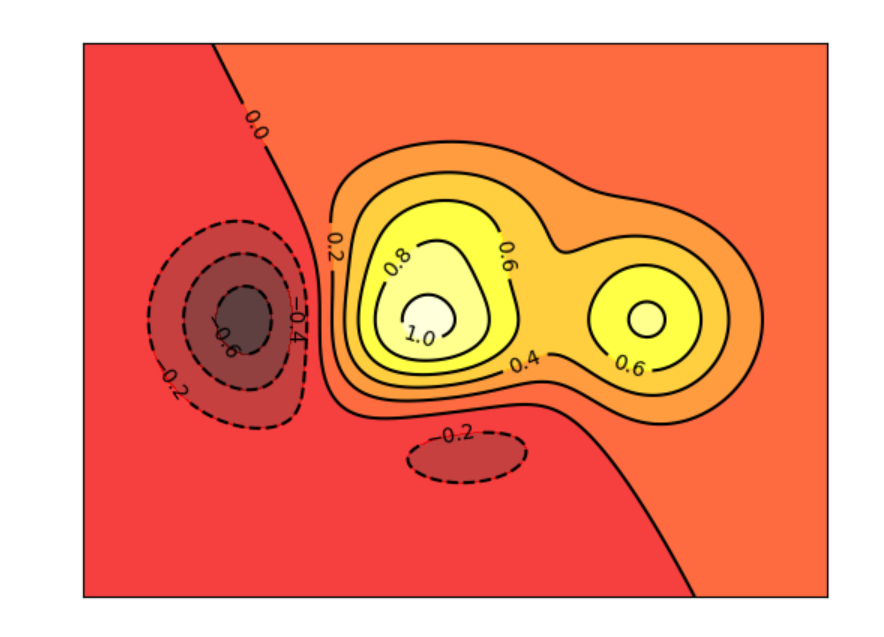
 1 import matplotlib.pyplot as plt
 2 import numpy as np
 3
 4 def f(x,y):
 5     #the height function
 6     return (1-x/2+x**5+y**3)*np.exp(-x**2-y**2)
 7
 8 n = 256
 9 x = np.linspace(-3,3,n)
10 y = np.linspace(-3,3,n)
11
12 X,Y = np.meshgrid(x,y)
13
14 #use plt.contourf to filling coutours
15 #X,Y and value for (X,Y) point
16 plt.contourf(X,Y,f(X,Y),8,alpha=0.75,cmap=plt.cm.hot)
17 #use plt.contour to add contour lines
18 C = plt.contour(X,Y,f(X,Y),8,colors='black')
19 #adding label
20 plt.clabel(C,inline=True,fontsize=10)
21 plt.xticks(())
22 plt.yticks(())
23 plt.show()
运行结果如下: