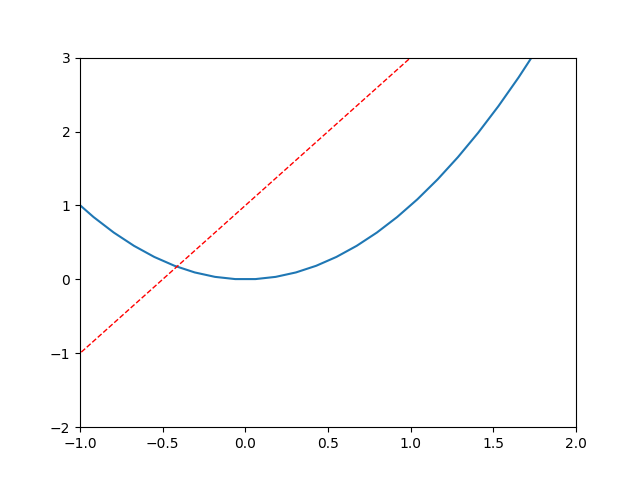
 1 import matplotlib.pyplot as plt
 2 import numpy as np
 3
 4 x = np.linspace(-3,3,50)
 5 y1 = 2*x+1
 6 y2 = x**2
 7
 8 plt.figure()
 9 plt.plot(x,y2)
10 plt.plot(x,y1,color='red',linewidth=1.0,linestyle='--')
11
12 plt.xlim((-1,2)) #设置x轴的范围
13 plt.ylim((-2,3)) #设置y轴的范围
14
15 plt.show()
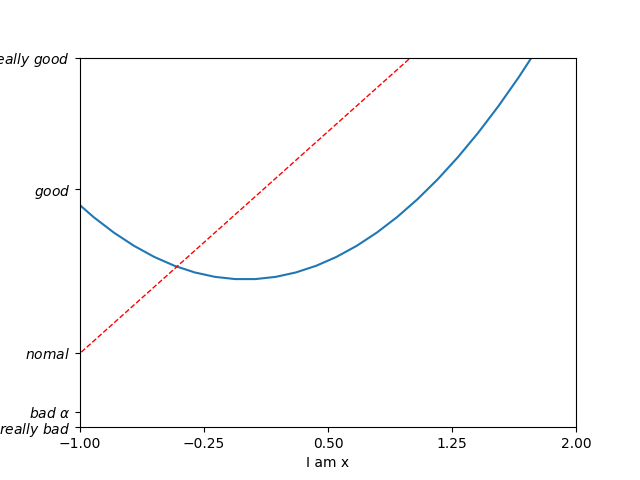
修改坐标轴的ticks和增加坐标轴的Label
 1 import matplotlib.pyplot as plt
 2 import numpy as np
 3
 4 x = np.linspace(-3,3,50)
 5 y1 = 2*x+1
 6 y2 = x**2
 7
 8 plt.figure()
 9 plt.plot(x,y2)
10 plt.plot(x,y1,color='red',linewidth=1.0,linestyle='--')
11
12 plt.xlim((-1,2)) #设置x轴的范围
13 plt.ylim((-2,3)) #设置y轴的范围
14 plt.xlabel('I am x') #设置x轴的label
15 plt.ylabel('I am y')#设置y轴label
16
17 new_ticks = np.linspace(-1,2,5)
18 print(new_ticks)
19 plt.xticks(new_ticks) #设置x轴间隔ticks
20 plt.yticks([-2,-1.8,-1,1.22,3],  #y轴ticks一一对应
21            [r'$really\ bad$',r'$bad\ \alpha$',r'$nomal$',r'$good$',r'$really\ good$'])
22
23
24 plt.show()
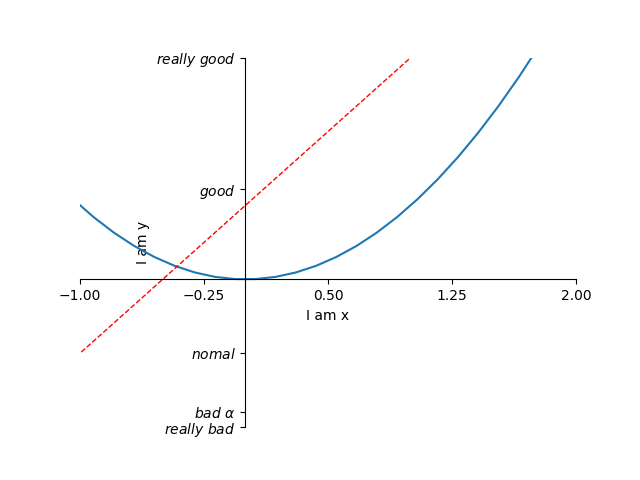
修改坐标轴的位置
 1 import matplotlib.pyplot as plt
 2 import numpy as np
 3
 4 x = np.linspace(-3,3,50)
 5 y1 = 2*x+1
 6 y2 = x**2
 7
 8 plt.figure()
 9 plt.plot(x,y2)
10 plt.plot(x,y1,color='red',linewidth=1.0,linestyle='--')
11
12 plt.xlim((-1,2)) #设置x轴的范围
13 plt.ylim((-2,3)) #设置y轴的范围
14 plt.xlabel('I am x') #设置x轴的label
15 plt.ylabel('I am y')#设置y轴label
16
17 new_ticks = np.linspace(-1,2,5)
18 print(new_ticks)
19 plt.xticks(new_ticks) #设置x轴间隔ticks
20 plt.yticks([-2,-1.8,-1,1.22,3],  #y轴ticks一一对应
21            [r'$really\ bad$',r'$bad\ \alpha$',r'$nomal$',r'$good$',r'$really\ good$'])
22
23 #gca = 'get current axis'
24 ax = plt.gca()
25 ax.spines['right'].set_color('none') #将右边的轴设置成空
26 ax.spines['top'].set_color('none')#将上面的轴设置为空
27 ax.xaxis.set_ticks_position('bottom')  #将最底下的轴设置为x轴
28 ax.yaxis.set_ticks_position('left') #将最左边的轴设置为y轴
29 #开始设置x轴和y轴位置
30 ax.spines['bottom'].set_position(('data',0)) #设置横轴的位置在纵坐标0的位置
31 ax.spines['left'].set_position(('data',0)) #设置纵轴的位置在横坐标为0的位置
32
33
34 plt.show()