matplotlib中如何将图例位置放在绘图区外
bbox_to_anchor参数
可以通过bbox_to_anchor参数将图例放置在坐标系外。bbox表示容纳图例的边界框-bounding box
plt.legend(bbox_to_anchor=(x0, y0, width, height), loc=)
width和height是图例框的宽度和高度,而(x0, y0)是边界框loc的坐标。
边界框的坐标是相对于坐标系的位置,(0,0)是坐标系的左下角,(1,1)是坐标系的右上角
loc参数可选值(默认为0):
| int | str |
|---|---|
| 0 | best |
| 1 | upper right |
| 2 | upper left |
| 3 | lower left |
| 4 | lower right |
| 5 | right |
| 6 | center left |
| 7 | center right |
| 8 | lower center |
| 9 | upper center |
| 10 | center |
示例
import matplotlib.pyplot as plt
import numpy as np

x = np.linspace(0, 10, 100)

plt.plot(x, np.sin(x), label="sin(x)")
plt.plot(x, np.cos(x), label="cos(x)")

plt.legend(bbox_to_anchor=(1.05, 1.0), loc='upper left')
plt.tight_layout()
plt.show()
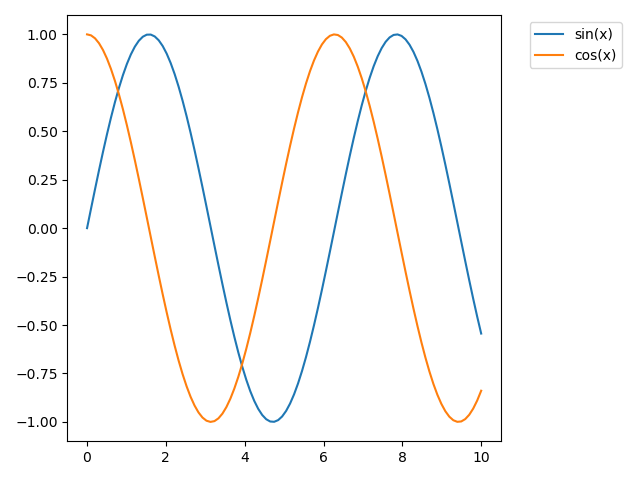
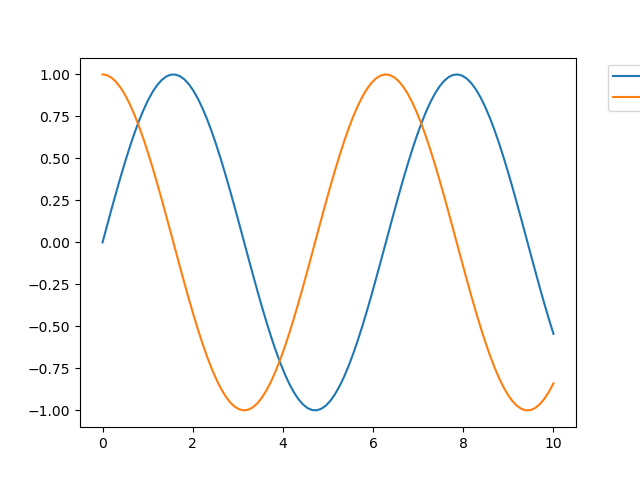
如果未调用tight_layout(),保存的图片将会显示不完整
import matplotlib.pyplot as plt
import numpy as np

x = np.linspace(0, 10, 100)

plt.plot(x, np.sin(x), label="sin(x)")
plt.plot(x, np.cos(x), label="cos(x)")

plt.legend(bbox_to_anchor=(1.05, 1.0), loc='upper left')
# plt.show()
# plt.tight_layout()
plt.savefig('0.png')
使用bbox_extra_artists 和 bbox_inches参数,防止图像保存时被裁剪
import matplotlib.pyplot as plt
import numpy as np

x = np.linspace(0, 10, 100)

plt.plot(x, np.sin(x), label="sin(x)")
plt.plot(x, np.cos(x), label="cos(x)")

lg = plt.legend(bbox_to_anchor=(1.05, 1.0), loc='upper left')

plt.savefig('example.png',
            dpi=300,
            format='png',
            bbox_extra_artists=(lg,),
            bbox_inches='tight')
bbox_extra_artists 指定 Artist 的列表,在计算bbox最小边界时会将这些Artist考虑在内。
如果將 bbox_inches 设定为 tight,它将计算出图中的紧凑型 bbox。
转载自:原文链接

 浙公网安备 33010602011771号