cuda gdb文档翻译
3 - getting started
3.1 设置cuda-gdb的调试环境
3.1.1 临时文件存放位置
By default, CUDA-GDB uses /tmp as the directory to store temporary files. To select a different directory, set the $TMPDIR environment variable.
3.1.2 Jetson Tegra设备上的使用
3.2 编译程序
3.2.1 调试编译选项
-g -G是nvcc的debug编译模式,务必开启。-g -G的含义是强制开启O0优化,只包含了dead-code消除和reg溢出的优化,然后把debug信息写到了binary中
省略:To compile your CUDA Fortran code with debgging information necessary for CUDA-GDB to work properly, pgfortran,
3.2.2 带有行号的编译
//todo
3.2.3 指定特定的gpu架构core
//todo
3.3 使用cuda-gdb
3.3.1运行desktop GUI的GPU上debug
//todo
3.3.2 多gpu调试
//todo
--gtest_filter="SM50_RegionFprop*"
3.3.3 远程调试
//todo
3.3.4 使用多个cuda-gdb
// todo
3.3.5 attch或detach进程
//todo
4 - cuda-gdb 扩展
4.1 命令命名规范
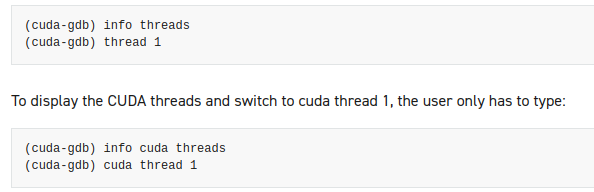
现有的gdb命令仍然可以使用,每个新的cuda命令或者选项都是在命令/选项前面包含cuda关键字,文档中用这个gdb调试多线程的命令举例
4.2 获得帮助
help
4.3 初始化文件
命令为.cuda-gdbinit,遵从.gdbinit规则
4.4 gui
//todo
4.5 coredump
//todo
设置环境变量CUDA_ENABLE_COREDUMP_ON_EXCEPTION=1 生成 GPU coredump
设置环境变量 CUDA_ENABLE_CPU_COREDUMP_ON_EXCEPTION=1 生成 CPU coredump
设置环境变量export CUDA_COREDUMP_FILE="/home/$USER/newName.%h.%p"指定coredump文件位置,一般就=${PWD}
(cuda-gdb) target cudacore core.cuda.localhost.1234在gdb中加载 GPU core dump文件
(cuda-gdb) target core core.cpu core.cuda在gdb中加载 CPU&GPU core dump文件
5 - kernel focus
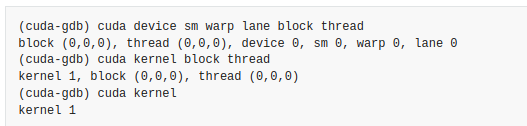
5.2 检查当前focus
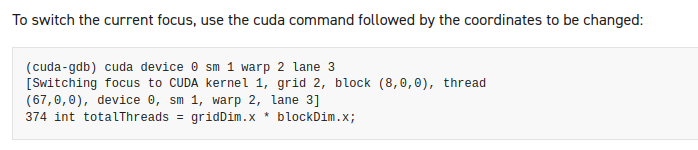
5.3 切换focus
6 - 程序执行
6.1 中断程序
ctrl c
6.2 单步
device的单步是以warp为单位的,在deivce上单步时,单步的是当前focus的warp内所有激活线程。分化的未激活thread不会单步
为了推动不止当前这个warp的单步,需要设置break
一个特殊情况是__syncthreads,这里是线程块内的同步,会设置implicit的break,因此到达这个hit的时候,所有的线程才会恢复
可以单步,步入,步出所有的deice函数,只要不是inline就行。
动态并行时,可以在DEVICE上调用cuda api,有如下规则:
当遇到启动一个kernel时,步入和单步的结果是相同的,都会跳过这个kernel
当单步一个grid完成时,focus会回到cpu上,可以进行切换focus操作,就是切换到其他的grid。
7 - break 和 watch
在device代码上设置break,会是一个pending状态,等到kernel的elf加载后才会成为一个break
当一个线程hit这个break时,其他的线程不一定会hit到这里,所以同一个break会被hit多次,所以在调试过程中要注意是哪一个线程hit了这个break,disable命令可以使其他的线程不会hit这里。
7.1 符号break
如果要break一个函数的入口地址,可以直接用函数名来指明break的位置。对于带有模板信息的函数,需要指明具体的模板信息
在调试cutlass时,经验是1: 可以使用rbreak来略过大量的模板参数,但如果发现rbreak仍然没有break到预期的位置,说明是符号还没有加载,可以先把程序运行一遍,这样符号就全部加载了,然后再进行rbreak就可以,此时restart就行。
In compiler construction, name mangling (also called name decoration) is a technique used to solve various problems caused by the need to resolve unique names for programming entities in many modern programming languages.
It provides a way of encoding additional information in the name of a function, structure, class or another datatype in order to pass more semantic information from the compiler to the linker.
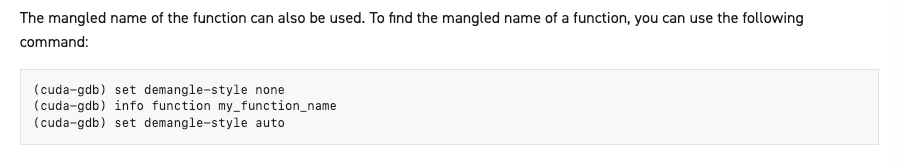
为了给一个符号指定一个唯一的名称,会进行name mangling.
在设置break时可以使用mangled name,也可以去掉mangled,方便找到原函数名
7.2 line break
这个在模板代码中不太好用
7.3 地址break
可以break一个具体的内存地址,这个地址实际上应该是pc寄存器后面会移动到的值
7.4 kernel入口break
break_on_launch是为了给启动的kernel设置启动断点的,如果设置为set cuda break_on_launch application,那么会在启动的kernel的第一条指令处break。
此外,这种断点不会显示在info break中
break_on_launch共4种选项:none(不会设置break on launch)/system(由驱动程序启动的kernel,例如memset)/all(全部)/application(用户程序所启动的kernel)
7.5 条件break
// todo
7.6 watch point
不支持!
8 - 检查程序状态
8.1 内存和变量
print命令可以识别变量所处的位置,比如global/shared
8.2 变量存储和可访问性
我觉得这里涉及一些gdb的检查变量方法的基础,参考gdb文档
取决于变量的类型和使用方法,变量或许存储在reg中,local/shared/const/global内存中
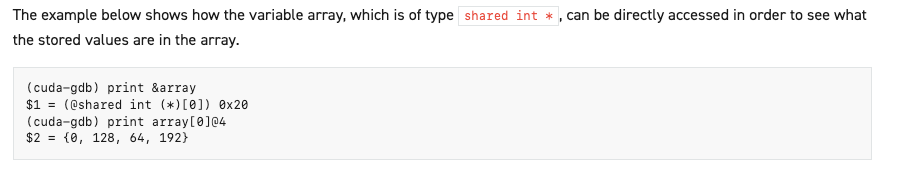
首先print一下array的地址,提示是在shared中。
然后使用array[0]@4来读取array起始地址开始的4个元素
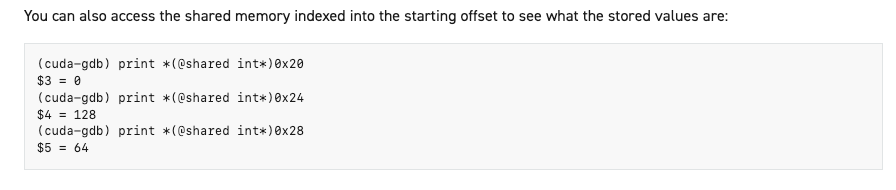
或者通过地址来指定print的元素
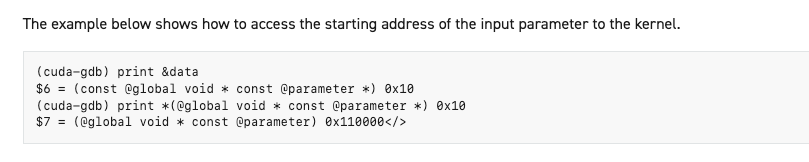
获取输入参数的起始地址
12 - tips
12.2 break on launch
12.3 launch block
set cuda launch_blocking on可以将kernel设置为同步的。在debugging中,将kernel设置为同步的(blocking)可以使kernel launch是串行的,方便于debug。
set cuda launch_blocking off是设置为同步或异步的,具体由程序检测来决定。
10
10.3 autostep
autostep是用来检查具体的哪一个线程或指令导致了cuda的exception
在正常的调试过程中,
//todo
本文来自博客园,作者:ijpq,转载请注明原文链接:https://www.cnblogs.com/ijpq/p/17028732.html

 浙公网安备 33010602011771号