在html中使用uve+echarts进行数据可视化
主要用到的库
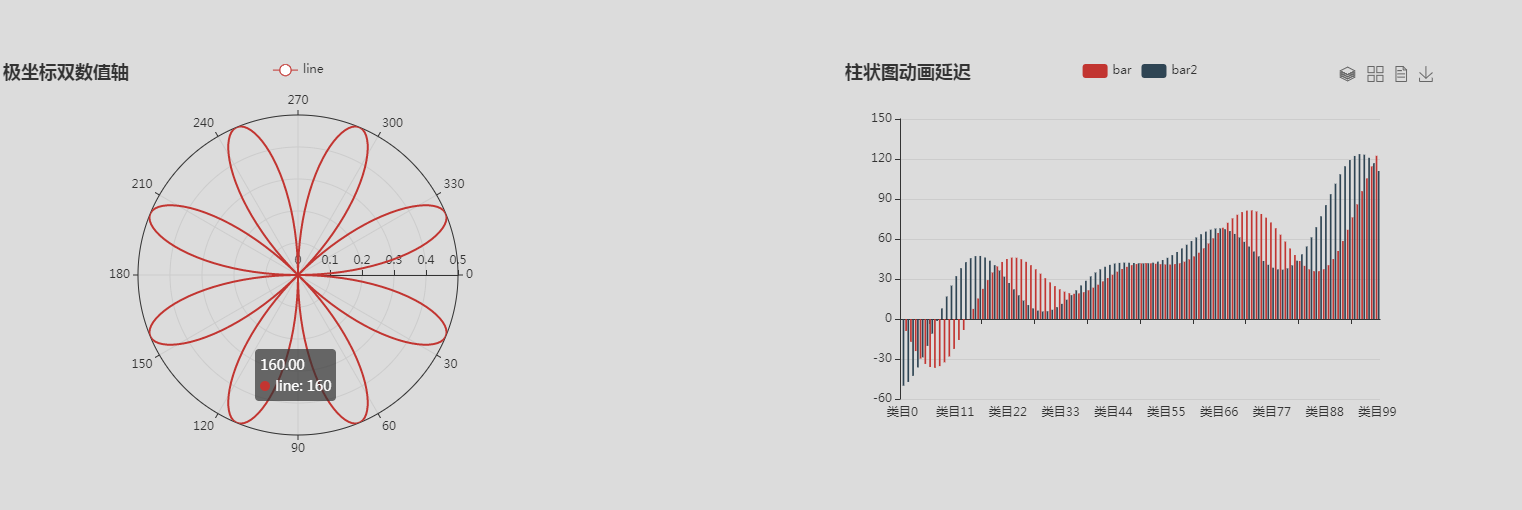
示例
直上代码
<!DOCTYPE html>
<html>

<head>
    <title>DataV</title>
    <!-- 引入uvejs组件库 -->
    <script src="https://unpkg.com/vue"></script>
    <!-- 引入echarts组件库 -->
    <script src="https://cdn.jsdelivr.net/npm/echarts@4.1.0/dist/echarts.js"></script>
    <!-- 引入vue-echarts组件库 -->
    <script src="https://cdn.jsdelivr.net/npm/vue-echarts@4.0.2"></script>

    <!-- 引入elementUI样式 -->
    <link rel="stylesheet" href="https://unpkg.com/element-ui/lib/theme-chalk/index.css">
    <!-- 引入elementUI组件库 -->
    <script src="https://unpkg.com/element-ui/lib/index.js"></script>
    <style>
        html,
        body,
        #app {
            width: 100%;
            height: 100%;
            margin: 0px;
            padding: 0px;
            background-color: gainsboro;
        }

        .border-box-content {
            color: rgb(66, 185, 131);
            font-size: 40px;
            font-weight: bold;
            display: flex;
            justify-content: center;
            align-items: center;
        }
    </style>
</head>

<body>
    <div id="app">

        <el-row :gutter="20" style="margin-top: 100px;">
            <el-col :span="12">
                <v-chart :options="polar1" />
            </el-col>
            <el-col :span="12">
                <v-chart :options="ce3" />
            </el-col>

        </el-row>

    </div>

    <script>
        var app = new Vue({
            el: '#app',
            components: {
                'v-chart': VueECharts
            },
            data() {
                let data = []

                for (let i = 0; i <= 360; i++) {
                    let t = i / 180 * Math.PI
                    let r = Math.sin(2 * t) * Math.cos(2 * t)
                    data.push([r, i])
                }

                var xAxisData = [];
                var data1 = [];
                var data2 = [];
                for (var i = 0; i < 100; i++) {
                    xAxisData.push('类目' + i);
                    data1.push((Math.sin(i / 5) * (i / 5 - 10) + i / 6) * 5);
                    data2.push((Math.cos(i / 5) * (i / 5 - 10) + i / 6) * 5);
                }

                return {

                    polar1: {
                        title: {
                            text: '极坐标双数值轴'
                        },
                        legend: {
                            data: ['line']
                        },
                        polar: {
                            center: ['50%', '54%']
                        },
                        tooltip: {
                            trigger: 'axis',
                            axisPointer: {
                                type: 'cross'
                            }
                        },
                        angleAxis: {
                            type: 'value',
                            startAngle: 0
                        },
                        radiusAxis: {
                            min: 0
                        },
                        series: [{
                            coordinateSystem: 'polar',
                            name: 'line',
                            type: 'line',
                            showSymbol: false,
                            data: data
                        }],
                        animationDuration: 2000
                    },
                    ce2: {
                        xAxis: {
                            type: 'category',
                            data: ['Mon', 'Tue', 'Wed', 'Thu', 'Fri', 'Sat', 'Sun']
                        },
                        yAxis: {
                            type: 'value'
                        },
                        series: [{
                            data: [820, 932, 901, 934, 1290, 1330, 1320],
                            type: 'line'
                        }]
                    },
                    ce3: {
                        title: {
                            text: '柱状图动画延迟'
                        },
                        legend: {
                            data: ['bar', 'bar2']
                        },
                        toolbox: {
                            // y: 'bottom',
                            feature: {
                                magicType: {
                                    type: ['stack', 'tiled']
                                },
                                dataView: {},
                                saveAsImage: {
                                    pixelRatio: 2
                                }
                            }
                        },
                        tooltip: {},
                        xAxis: {
                            data: xAxisData,
                            splitLine: {
                                show: false
                            }
                        },
                        yAxis: {},
                        series: [{
                            name: 'bar',
                            type: 'bar',
                            data: data1,
                            animationDelay: function (idx) {
                                return idx * 10;
                            }
                        }, {
                            name: 'bar2',
                            type: 'bar',
                            data: data2,
                            animationDelay: function (idx) {
                                return idx * 10 + 100;
                            }
                        }],
                        animationEasing: 'elasticOut',
                        animationDelayUpdate: function (idx) {
                            return idx * 5;
                        }
                    }

                }

            }

        })
    </script>
</body>

</html>
本文为原创文章,想了解更多信息欢迎访问我的博客
https://www.cnblogs.com/ihappycat/

 浙公网安备 33010602011771号