go 搭配 prometheus ,grafana 实现 监控 图表 报警 功能
配置 prometheus
先去这个网站下载 对应版本 的 prometheus prometheus 下载
然后
tar xvfz prometheus-*.tar.gz
cd prometheus-*
启动之前 先配置 vim prometheus.yml
prometheus.yml
# my global config
global:
scrape_interval: 15s # 将抓取间隔设置为每 15 秒。默认为每 1 分钟。
evaluation_interval: #15s 每 15 秒评估一次规则。默认值为每 1 分钟。
# 抓取超时 设置为全局默认值(10 秒)。
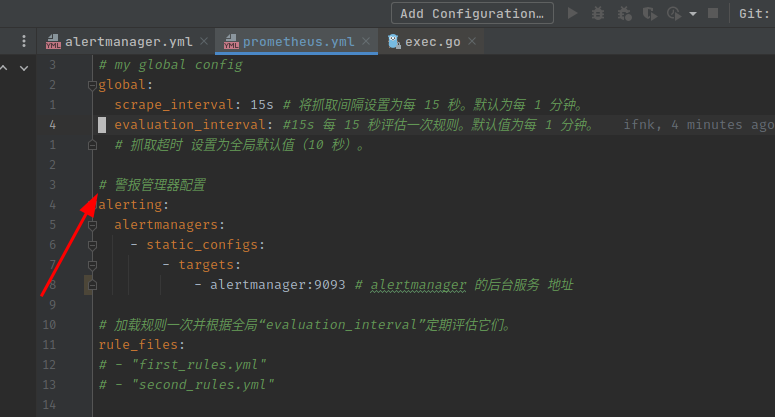
# 警报管理器配置
alerting:
alertmanagers:
- static_configs:
- targets:
# - alertmanager:9093
# 加载规则一次并根据全局“evaluation_interval”定期评估它们。
rule_files:
# - "first_rules.yml"
# - "second_rules.yml"
# 只包含一个要抓取的端点的抓取配置:
# 这里是普罗米修斯本身。
scrape_configs:
# 作业名称作为标签 `job=<job_name>` 添加到从此配置中抓取的任何时间序列中。
- job_name: "prometheus"
# 指标路径 默认 为 '/metrics'
# scheme defaults to 'http'. 方案默认为“http”。
static_configs:
- targets: [ "localhost:9090" ] # 这个监听的就是 prometheus 服务本身的指标 输入 http:://localhost:9090/metrics 就能看到
- job_name: 'node'
static_configs:
# 这个监听的就是 localhost 本身的 硬件指标(cpu 内存 硬盘 等信息 ,需要在 本机上面 安装 node_exporter 软件(具体百度)
- targets: [ 'localhost:9554' ]
labels:
group: 'x99-exporter'
- targets: [ 'localhost:8554' ] # 这个是 要自己写个go 程序 定义 port=8554 的服务 ,下面 会讲到
labels:
group: 'x99-metrics-client'
具体参数 可以 看官网 的文档 配置文档
然后执行 ./prometheus --config.file prometheus.yml 启动 prometheus 服务
这里最好 开 tmux 或者干脆 用 sh 脚本 做成个服务 ,不然占 你一个 命令行 窗口 ,不 ctrl+c 退出 就 干不了其他的事情了 ……
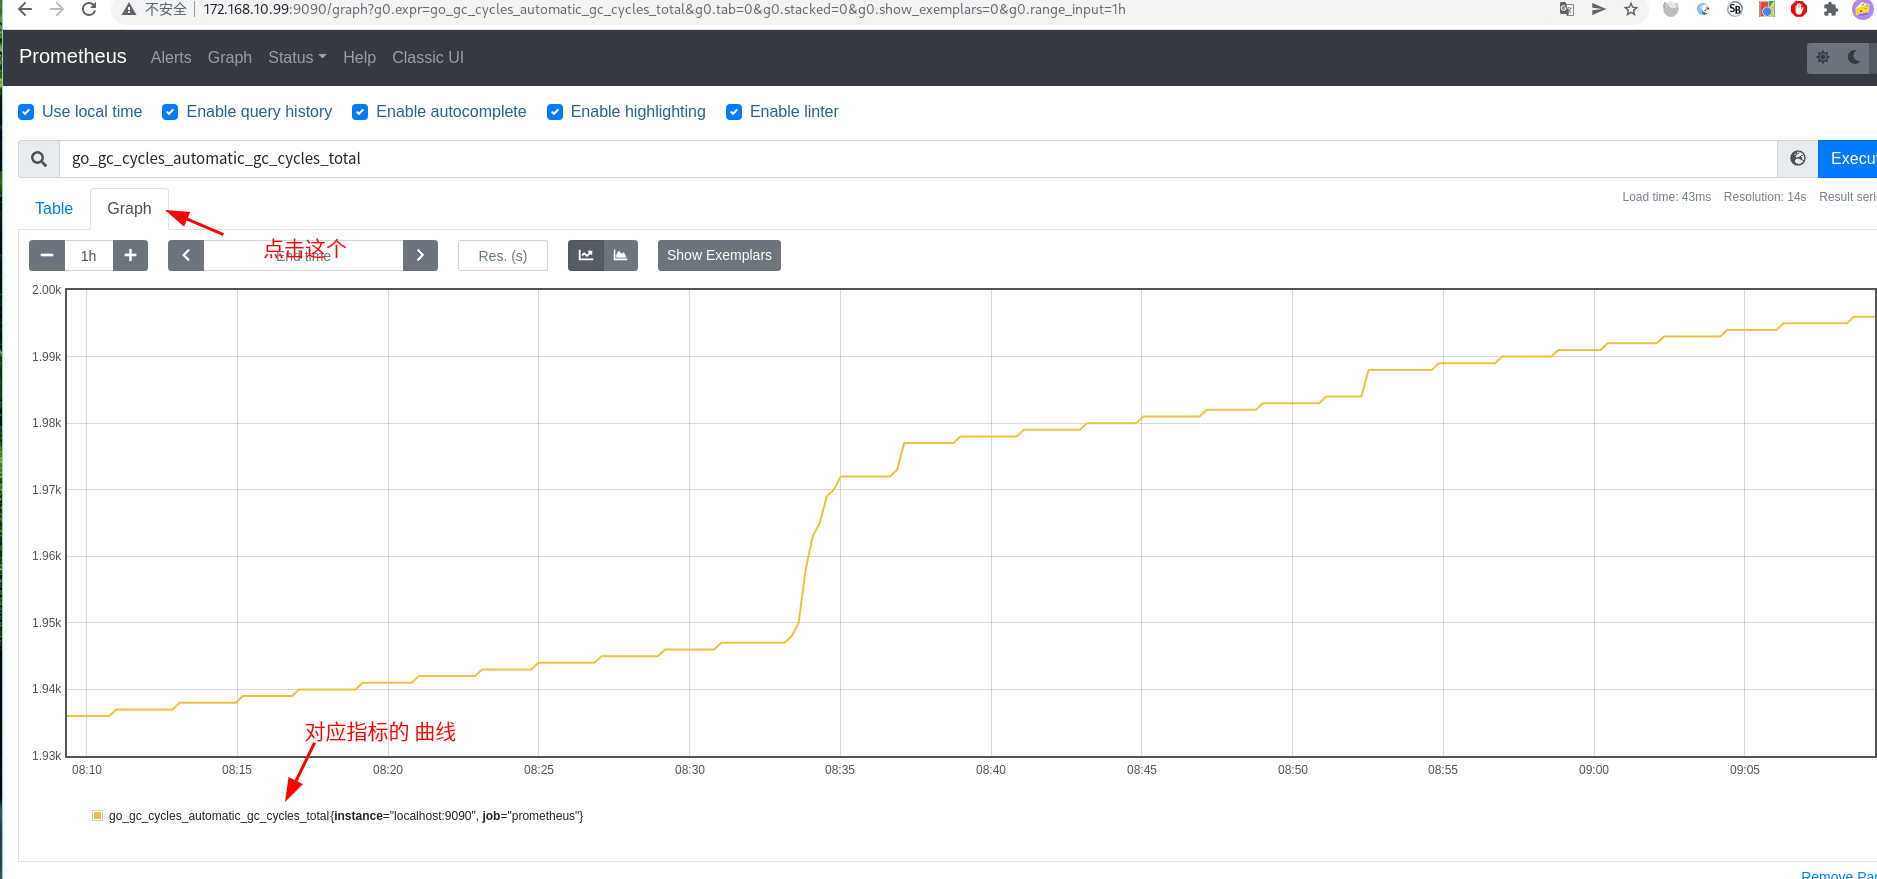
访问 http:😕/localhost:9090 (我这里是 http:😕/172.168.10.99:9090 我在172.168.10.99上安装 的prometheus 服务 )
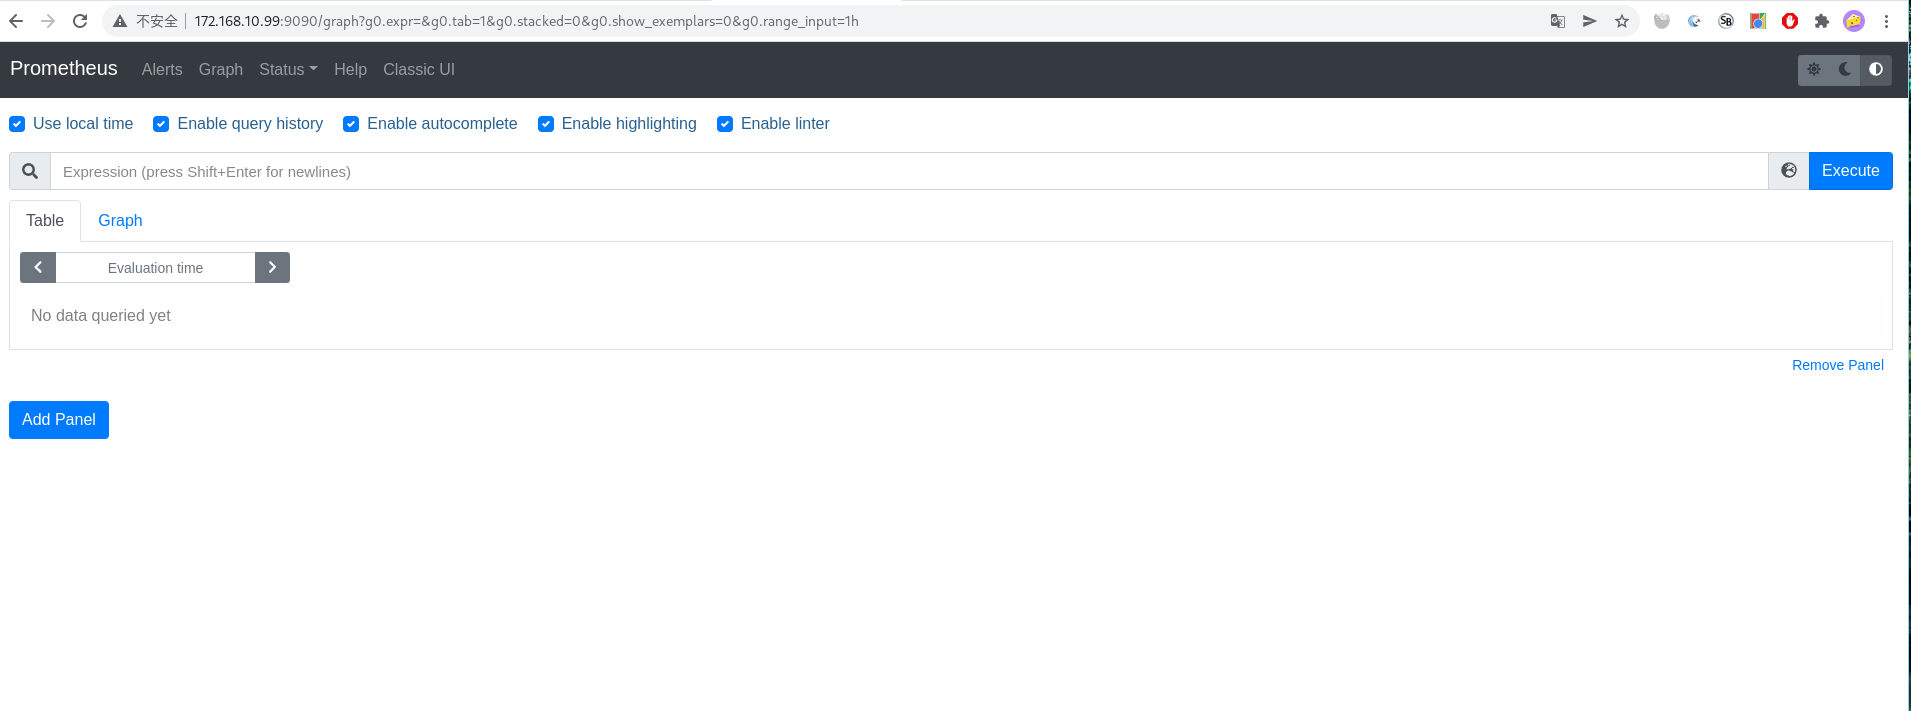
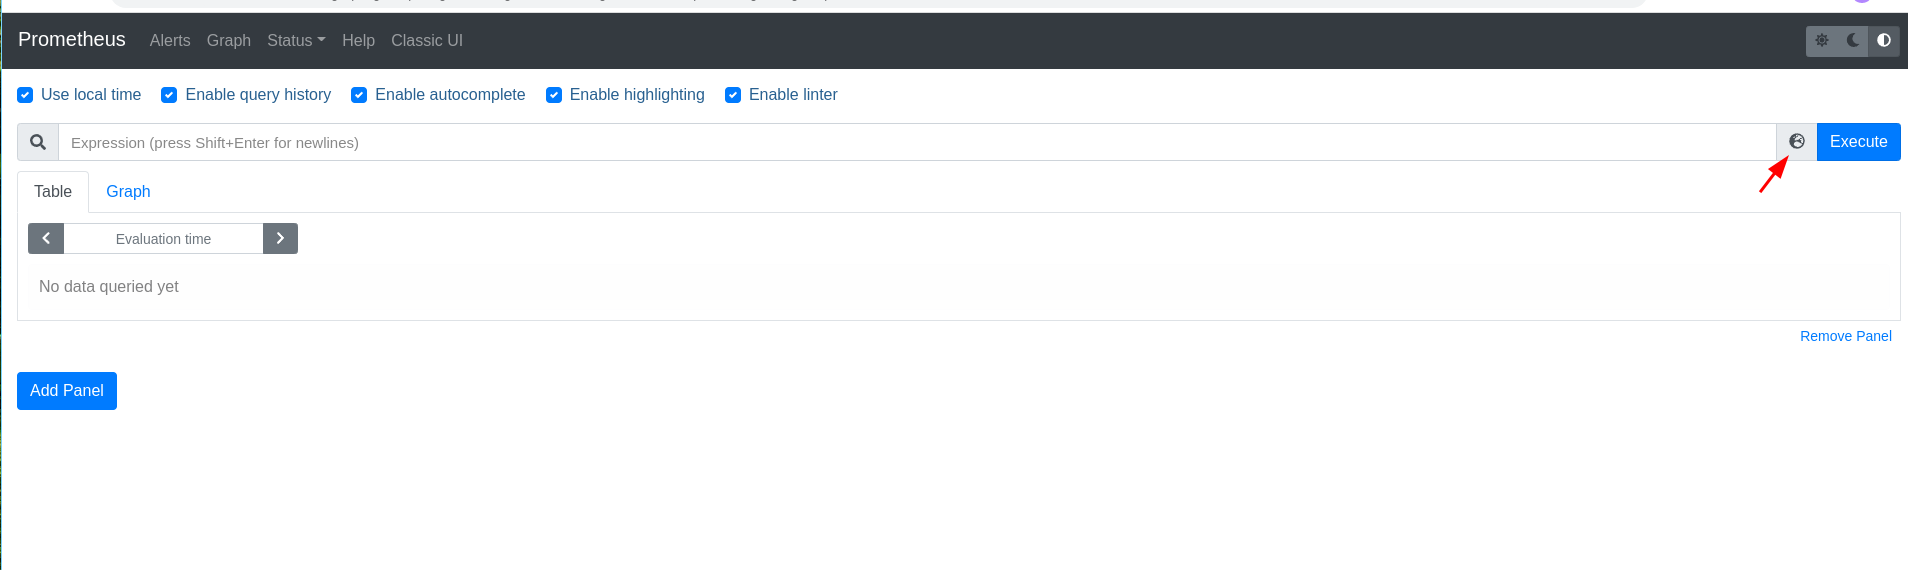
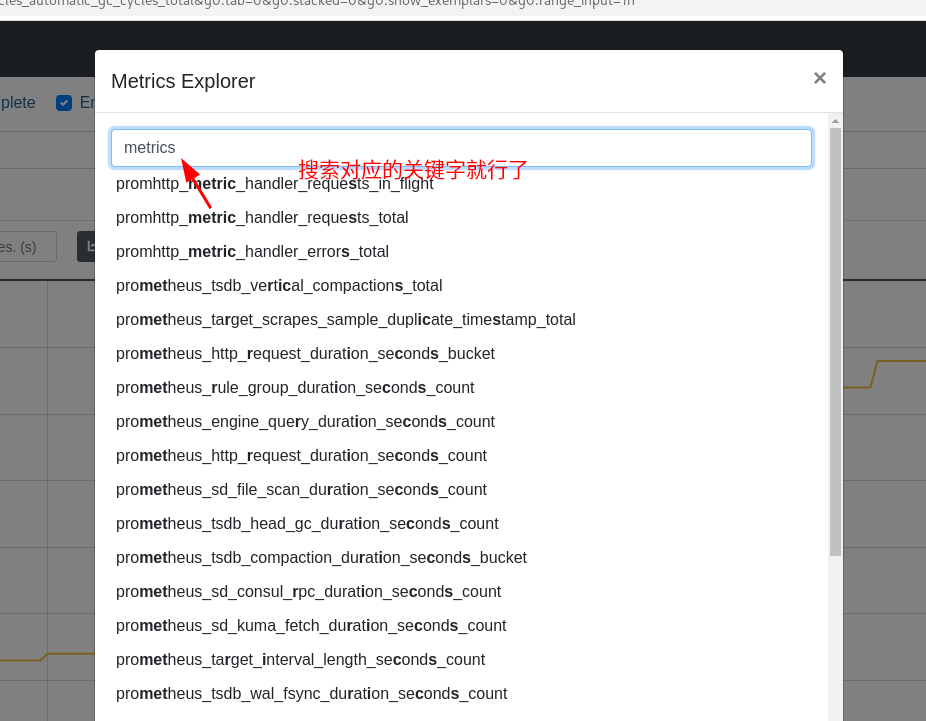
可以 点击 这个 地球 查看 已经收集的指标
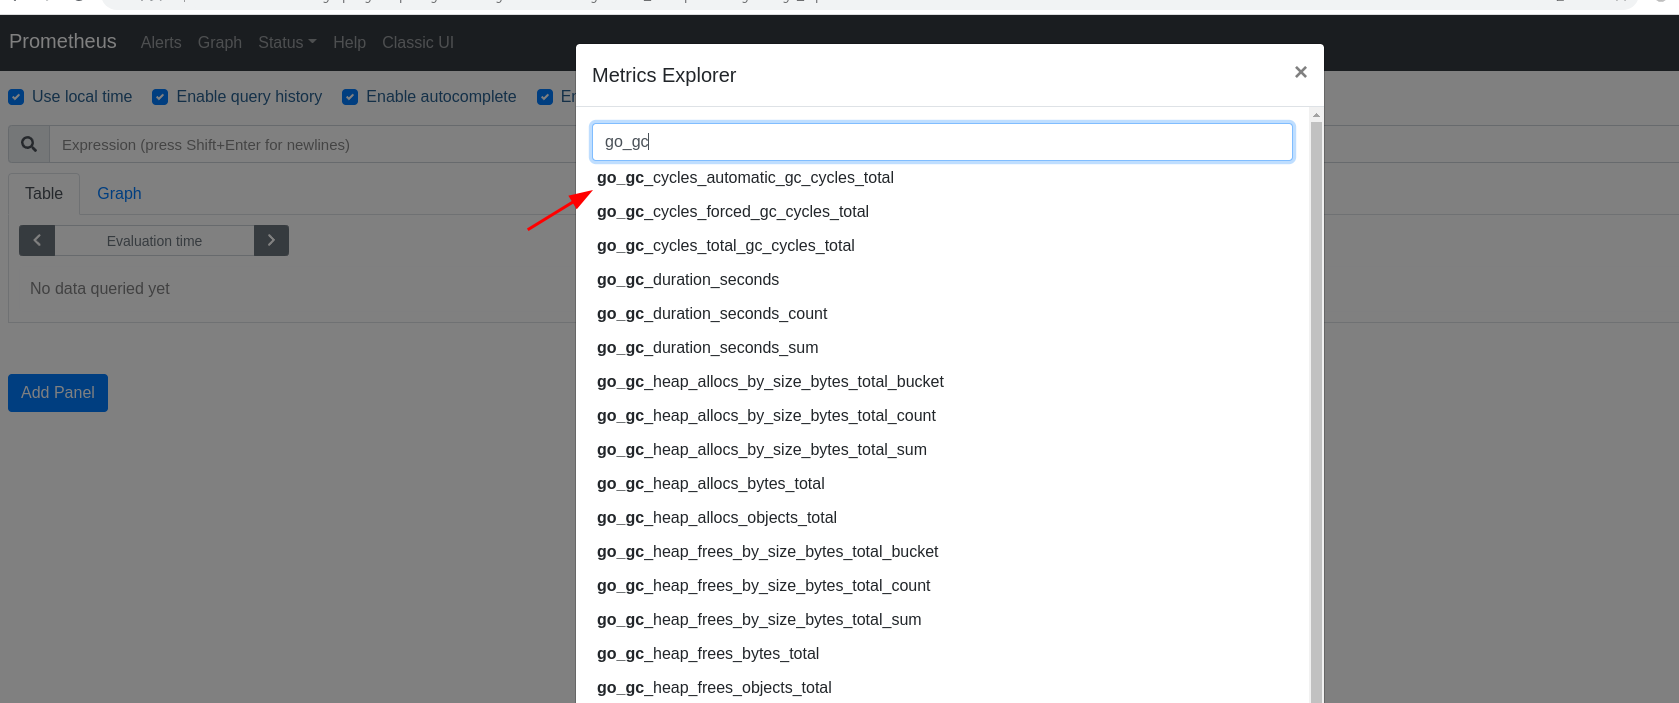
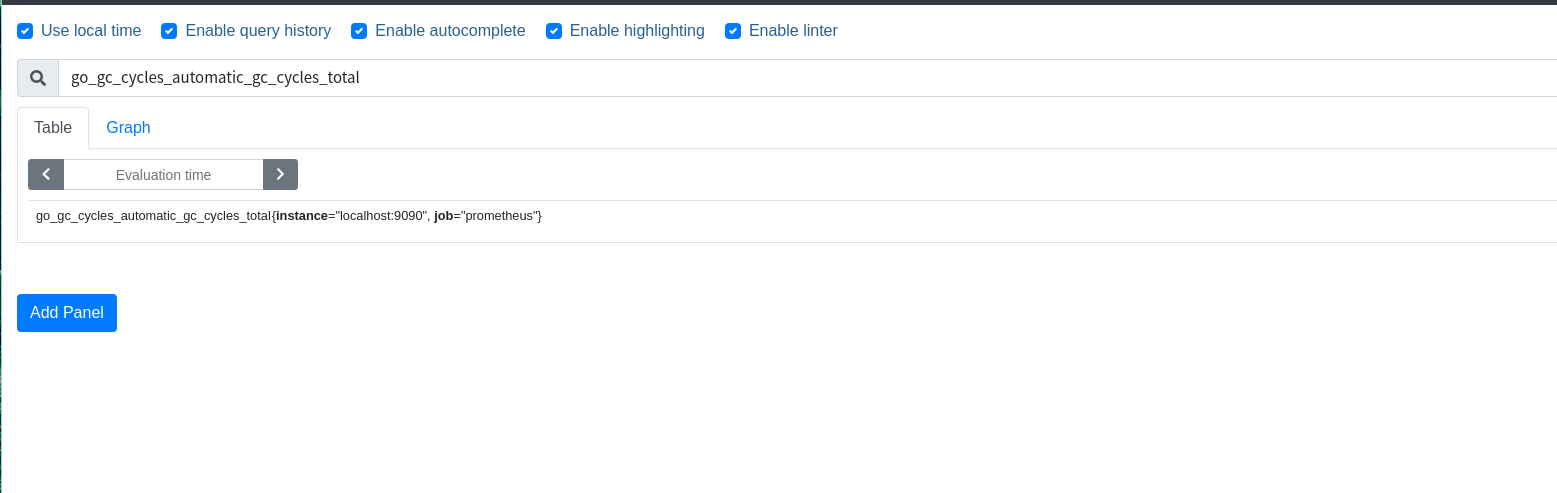
然后点击这个graph 就能看到 对应指标的 数据 变化曲线了
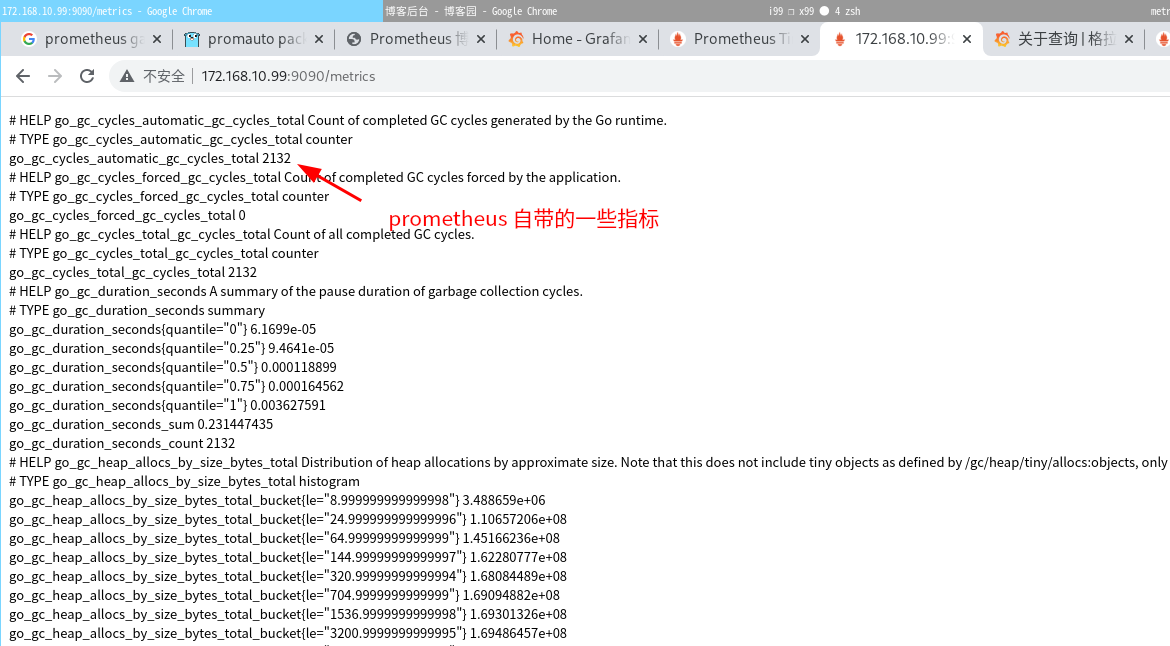
http:😕/localhost:9090/metrics 就是 prometheus 这个服务自身提供的指标
编写 go client 指标上报客户端
上面 的 http:😕/localhost:9090/metrics 是自带的指标,我们要是想自定义 指标上报 ,就 得自己写个 client ,然后给 prometheus server 上报就可以 了
写个 指标上报的 go 程序 注意prometheus pull metrics 指标的时候 有两种方式 一种是 下面代码的 定时 调用数据 然后 prometheus 收集,还有一种是 prometheus 每隔n 秒call metrics-client ,然后 metrics-client 调用命令 采集指标 这个在具体文档里面有 prometheus-go 代码示例
main.go
package main

import (
	"fmt"
	"github.com/fatih/color"
	"github.com/prometheus/client_golang/prometheus"
	"github.com/prometheus/client_golang/prometheus/promauto"
	"github.com/prometheus/client_golang/prometheus/promhttp"
	"net/http"
	"os/exec"
	"strconv"
	"strings"
	"time"
)

func main() {

	// metrics 有四种类型 [metrics 类型](https://prometheus.io/docs/concepts/metric_types/)
	// Counter Gauge Histogram Summary 我这里用的是 gauge 类型
	var gaugeVec = promauto.NewGaugeVec( // 定义一个自动注册的服务(这样不用手动写  prometheus.Register())
		prometheus.GaugeOpts{
			Namespace: "命名空间(英语)",
			Name:      "metrics1 ",
			Help:      "随便写写帮助",
		}, []string{ // 定义 label
			"ip",
			"n_start",
			"type",
		},
	) // 这样定义出来的格式就是 命名空间(英语)_metrics1{ip="xxx",n_start="xxx",type="xxx"} 0(float64类型) 这样的

	//每2秒,就 给 prometheus 传 指标数据
	go func() {
		for {
			// WithLabelValues 确定 label的值 ,set 确定这条数据 的值(这里写固定了,实际业务是要把 value 填进去的)
			gaugeVec.WithLabelValues("localhost", "02", "duduType").Set(233)
			time.Sleep(2 * time.Second)
		}
	}()

	http.Handle("/metrics", promhttp.Handler())  // 访问 /metrics 触发
	sprint := fmt.Sprintf("程序启动,正在坚挺 8554 端口 ")
	color.Blue(sprint)
	err := http.ListenAndServe(":8554", nil)
	if err != nil {
		sprint1 := fmt.Sprintf("程序启动失败, %+v", err)
		color.Blue(sprint1)
	}

}
执行 go run main.go 就把 指标客户 端 跑起来了
然后 在 prometheus 后台 搜索 就会有对应的数据
配置 grafana
grafana 是 用来 显示图表的 这里为 prometheus 数据 显示图标
下载安装 grafana
使用
默认情况下,Grafana 将监听 http://localhost:3000。默认登录名是“admin”/“admin”。
创建 Prometheus 数据源
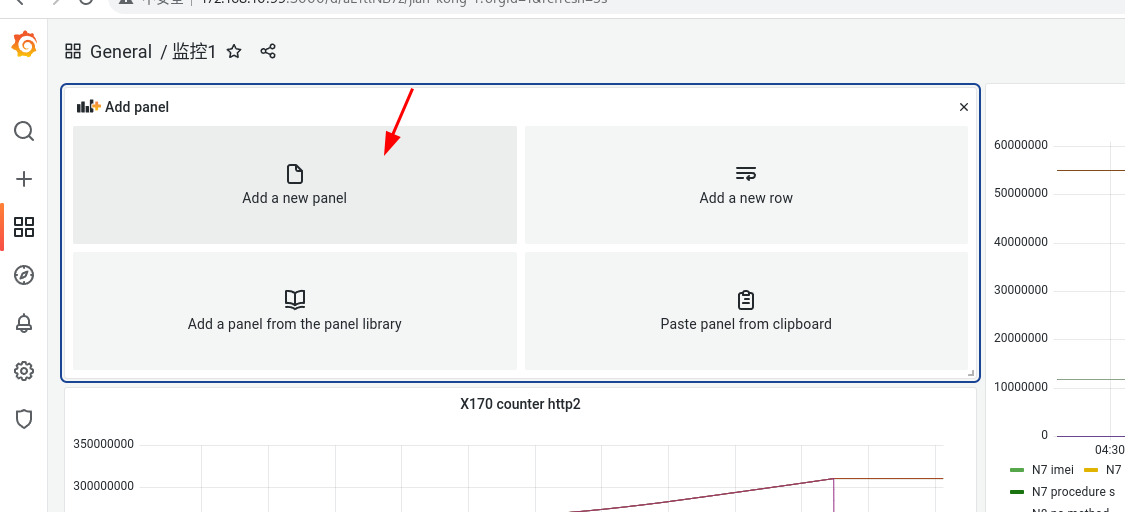
点击 dashboard -> home -> 创建 dashboard
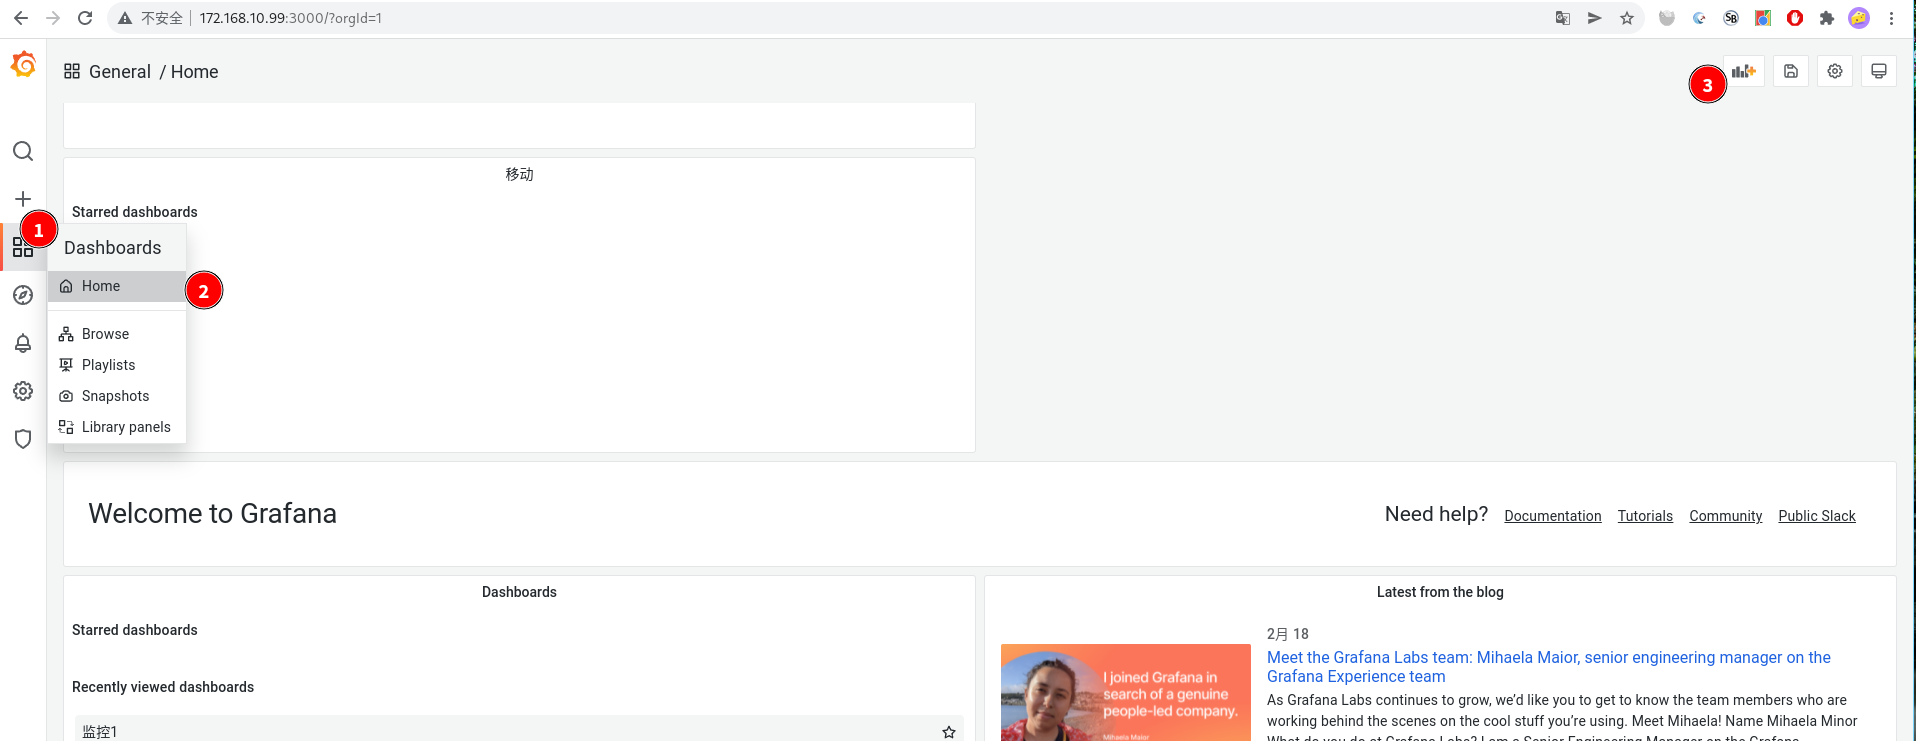
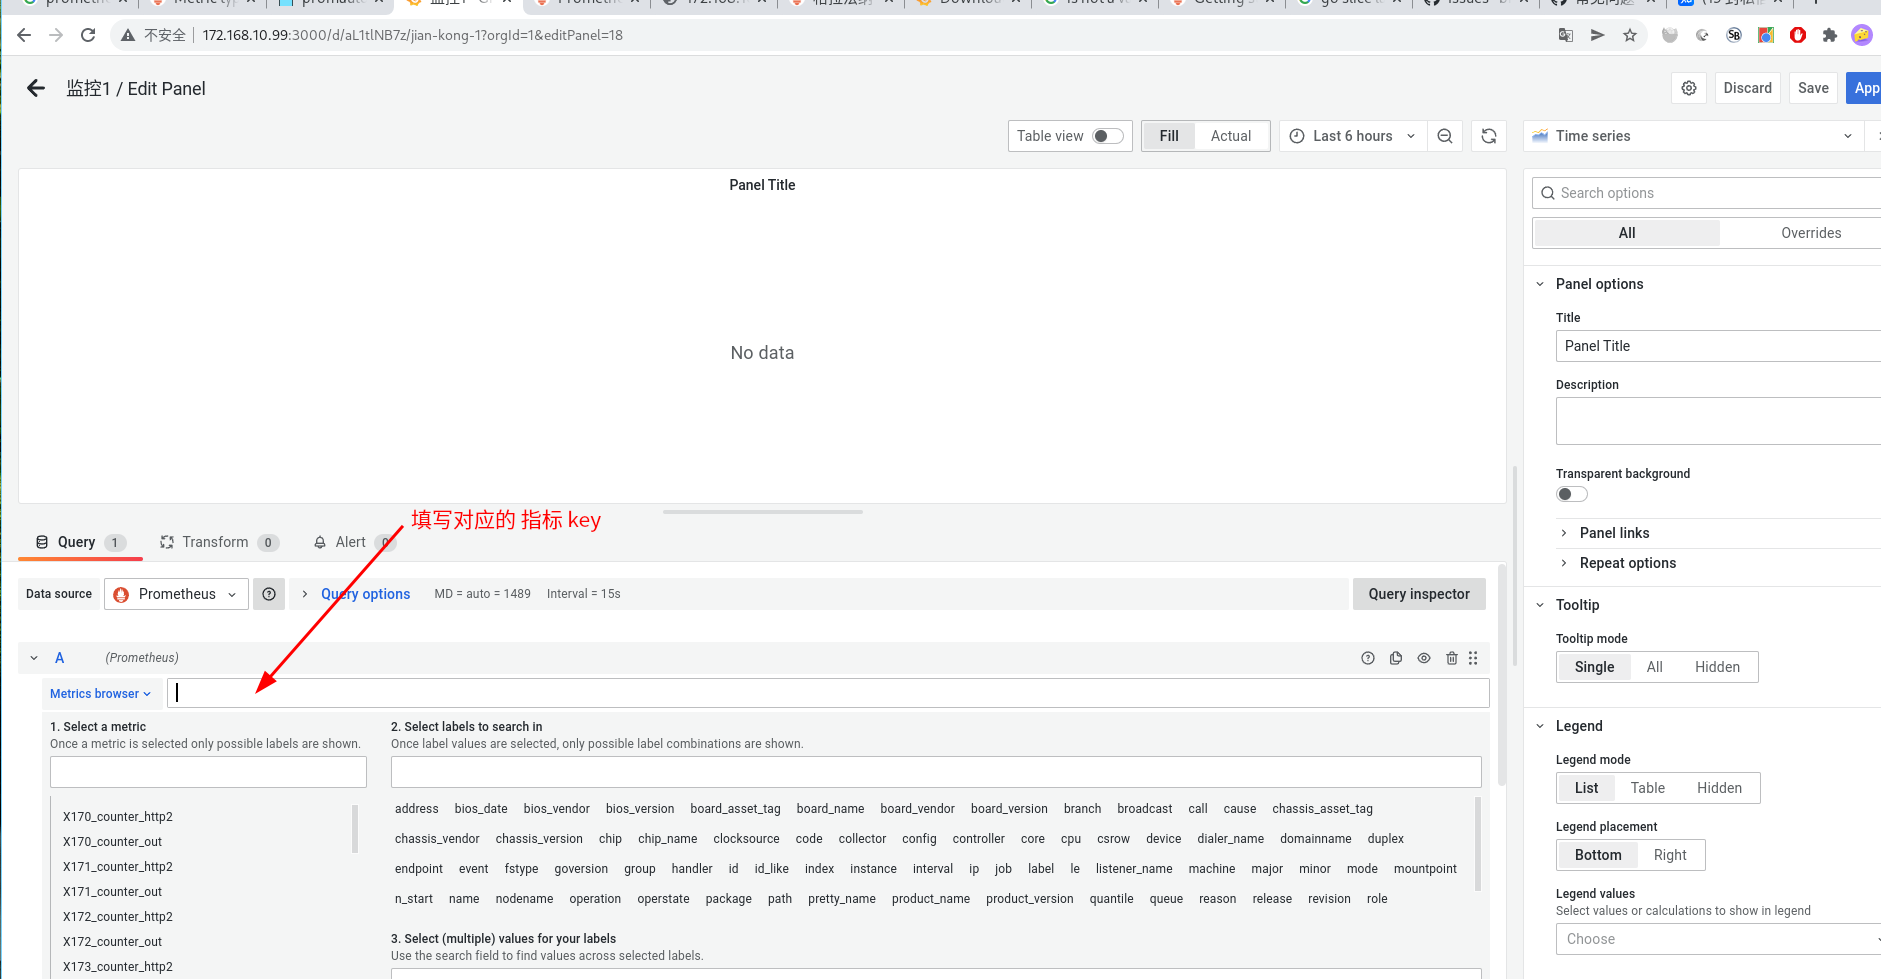
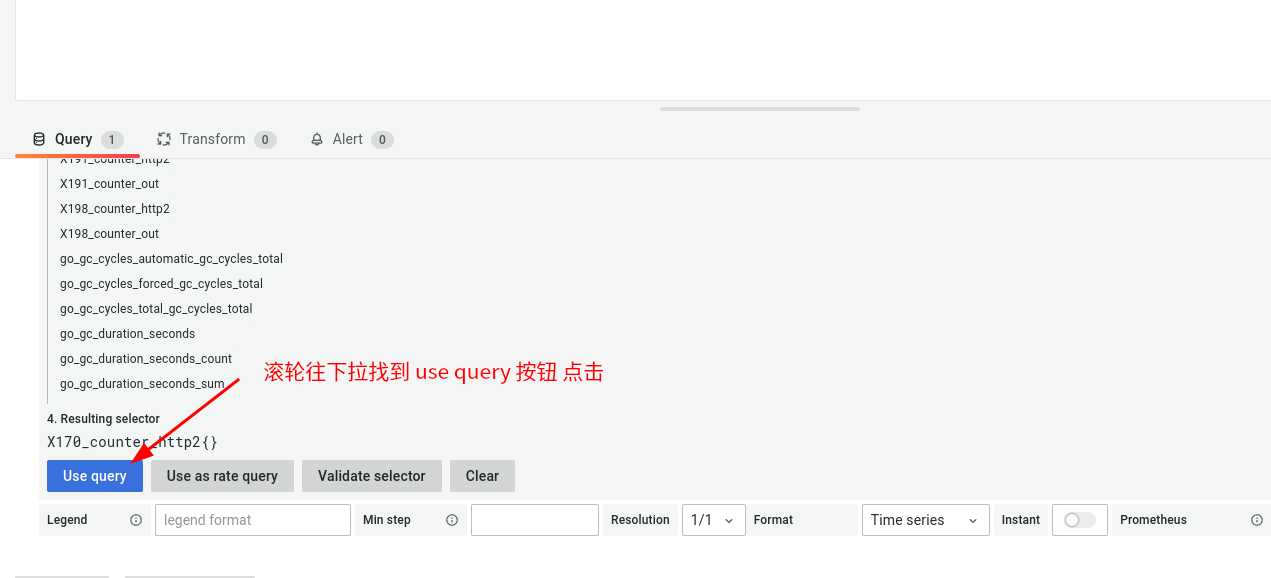
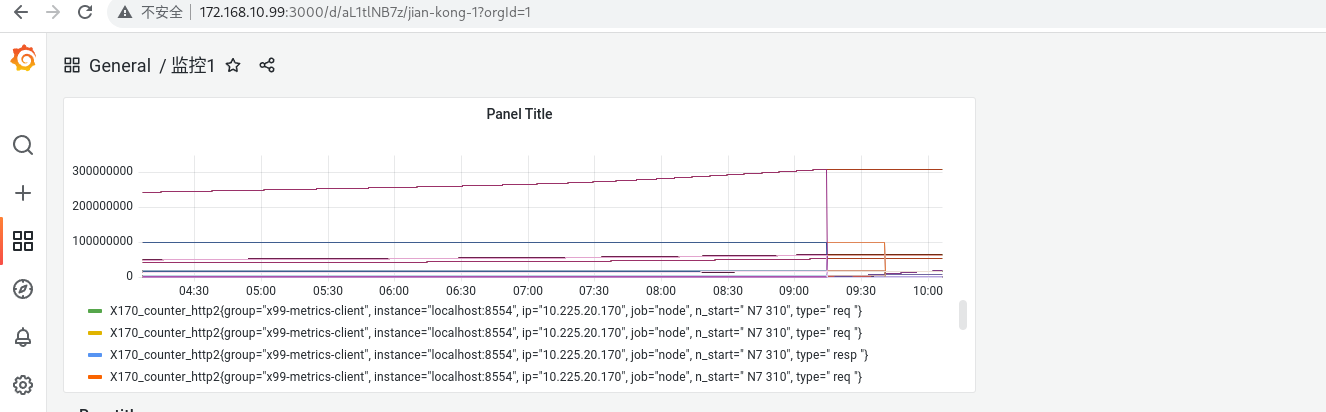
可以看到 对应指标的 图表 创建成功了
配置报警
安装 下载 alertManager
在github 上面 下载对应版本的 alertManager 下载地址
解压
tar -zxvf alertmanager-0.23.0.linux-amd64.tar.g
进入目录
cd alertmanager-0.23.0.linux-amd64
编辑 alertmanager.yml
# alertmanager 报警 配置
global:
  resolve_timeout: 5m
  smtp_smarthost: 'smtp.mxhichina.com:465' # 阿里邮箱
  smtp_from: 'ifnk@aliyouxiang.com' # 账户 名
  smtp_auth_username: 'ifnk@aliyouxiang.com' # 账户 名
  smtp_auth_password: 'dudu-dudu-dudu'  # 密码
  #smtp_auth_secret: false
  smtp_require_tls: false
  smtp_hello: 'qq.com'

route:
  group_by: ['alertname']
  group_wait: 1s
  group_interval: 5s
  repeat_interval: 60s
  receiver: 'mail'
receivers:
- name: 'mail'
  email_configs:
  - to: 'ifnk@aliyouxiang.com@hlytec.com'   # 要发送的邮箱地址 ,多个地址 用 逗号 隔开
运行
./alertmanager --config.file=alertmanager.yml
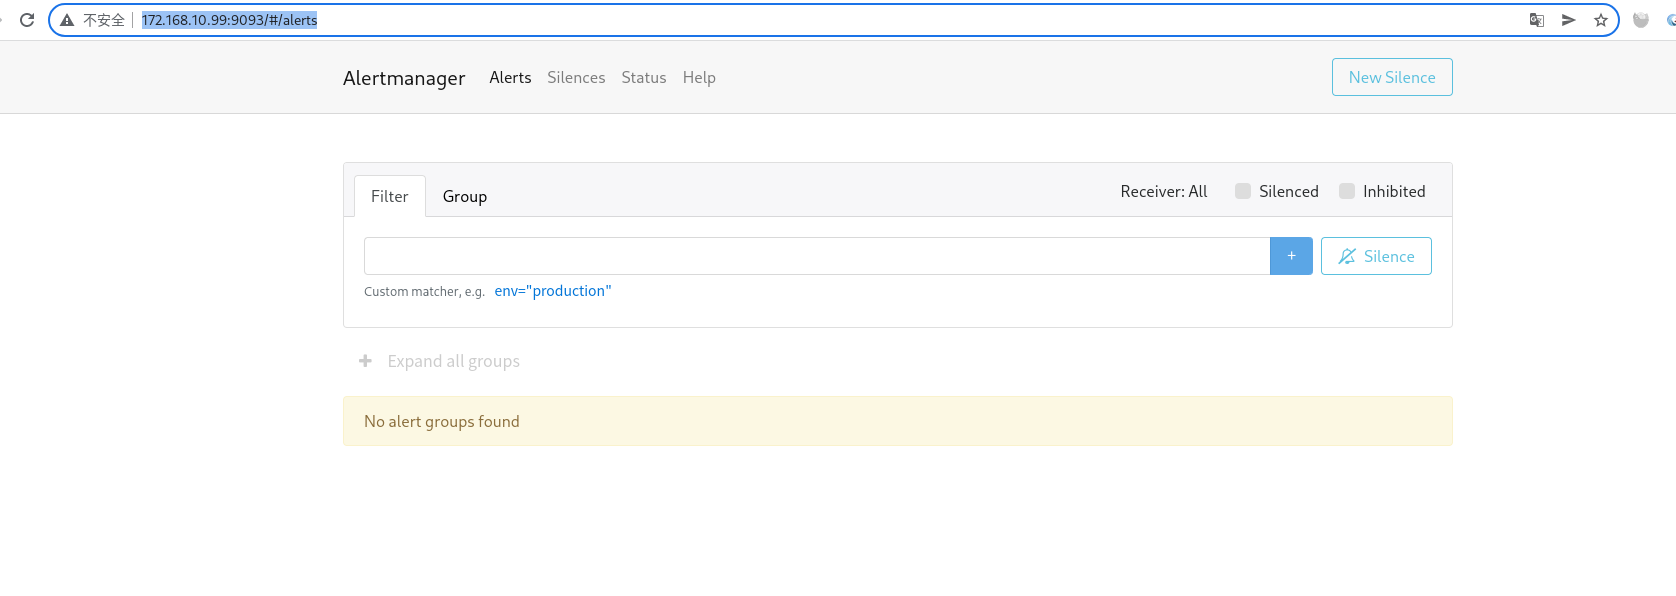
访问 http://172.168.10.99(你机器自己的ip):9093 即可看到 alertmanager 后台管理 页面
为Prometheus配置Alertmanager
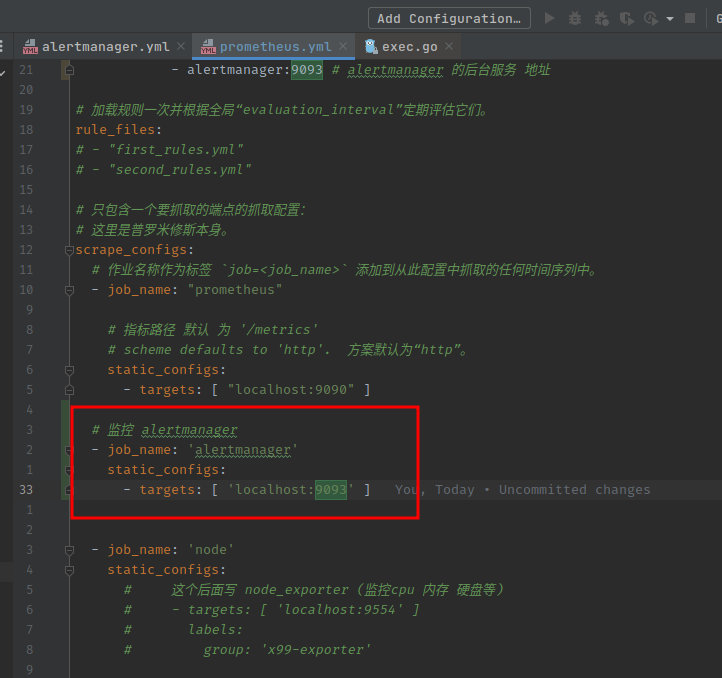
在 prometheus.yml 配置 alertmanager
监听 alertmanager 指标
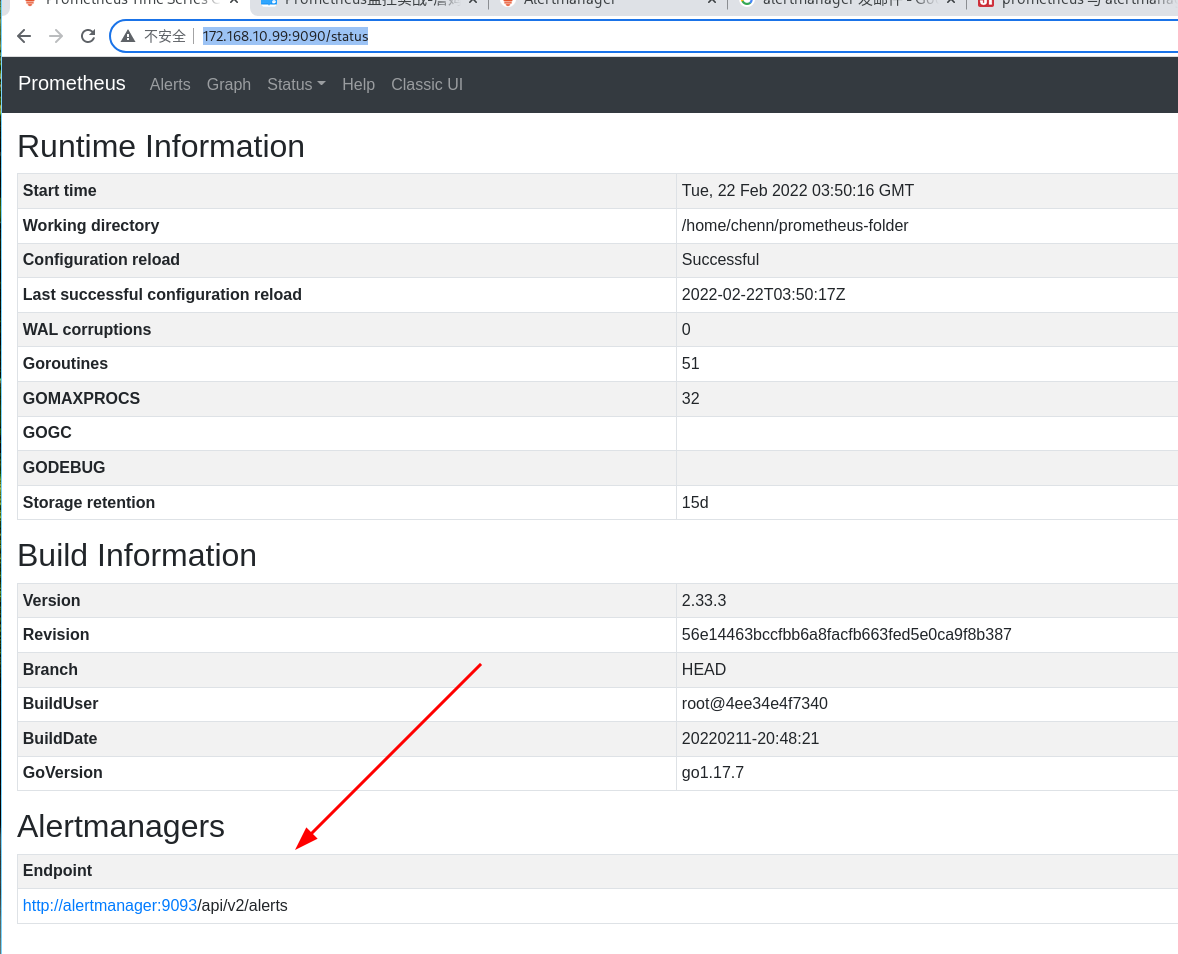
打开网址 http://localhost:9090/status 看看有没有成功
添加警报规则
现在Alertmanager已经配置完成,让我们添加第一条警报规则。
与记录规则一样,警报规则在Prometheus服务器配置中加载的规则文件内也使用YAML语句定义。
alert-rules.yml
# 报警规则
groups:
  - name: generals.rules
    rules:
      - alert: "程序可能崩了"
        expr:  (errCoreCount - errCoreCount offset 5s) > 0 # errCoreCount 当前数值减去 5秒前数值 大于0
        for: 1s # errCoreCount 当前数值减去 5秒前数值 大于0 的时间超过 1秒 就 给 alertmanager server 发送报警
        labels:
          severity: error
        annotations:
          summary: " {{ $labels.instance }} 的core 文件 增加了 "
          description: "{{ $labels.instance }} 的core 文件 增加了 ,很可能程序 崩了 "
然后 重启 prometheus 服务 打开 http://172.168.10.99:9090/alerts
就能看到 对应的规则了
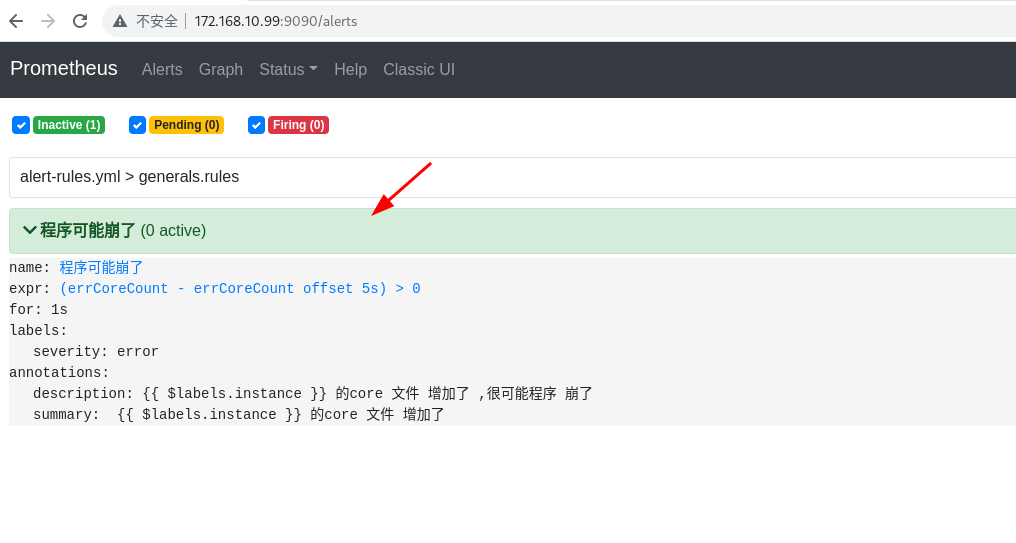
警报可能有以下三种状态:
·Inactive:警报未激活。
·Pending:警报已满足测试表达式条件,但仍在等待for子句中指定的持续时间。
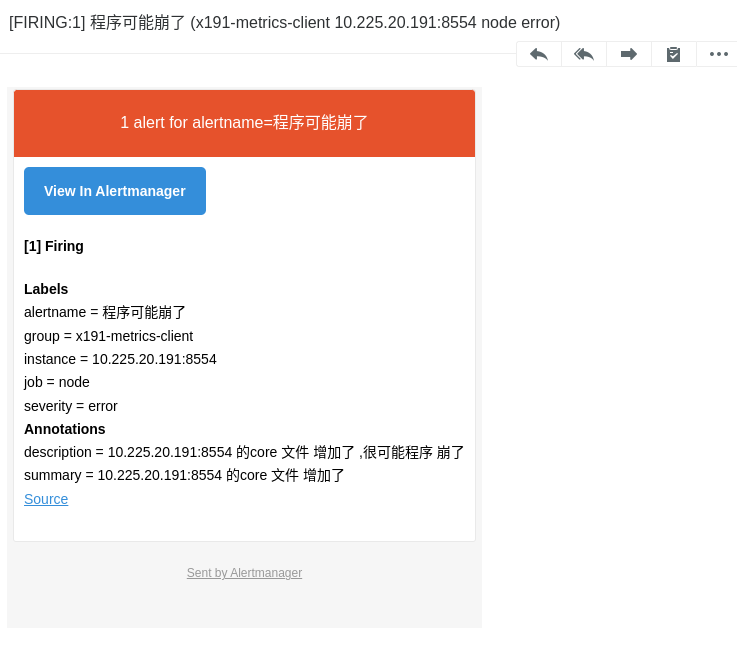
·Firing:警报已满足测试表达式条件,并且Pending的时间已超过for子句的持续时间。
并且邮件 也收到了
监控机器本身 的 指标 (cpu 内存 硬盘 网络 等 )
这个比较简单了 ,node-exporter 有人给做好了
下载 后
wget https://github.com/prometheus/node_exporter/releases/download/v*/node_exporter-*.*-amd64.tar.gz
tar xvfz node_exporter-*.*-amd64.tar.gz
cd node_exporter-*.*-amd64
./node_exporter --web.listen-address 0.0.0.0:9554  # 这里监 听端口 9554
然后 在 prometheus 里面 配置
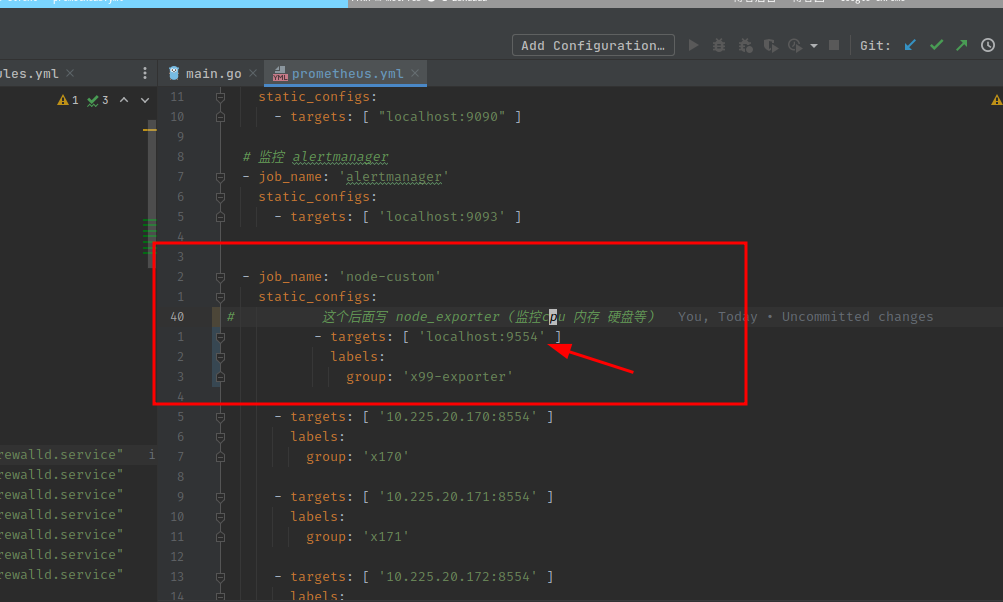
常见的参数 常见主机监控指标
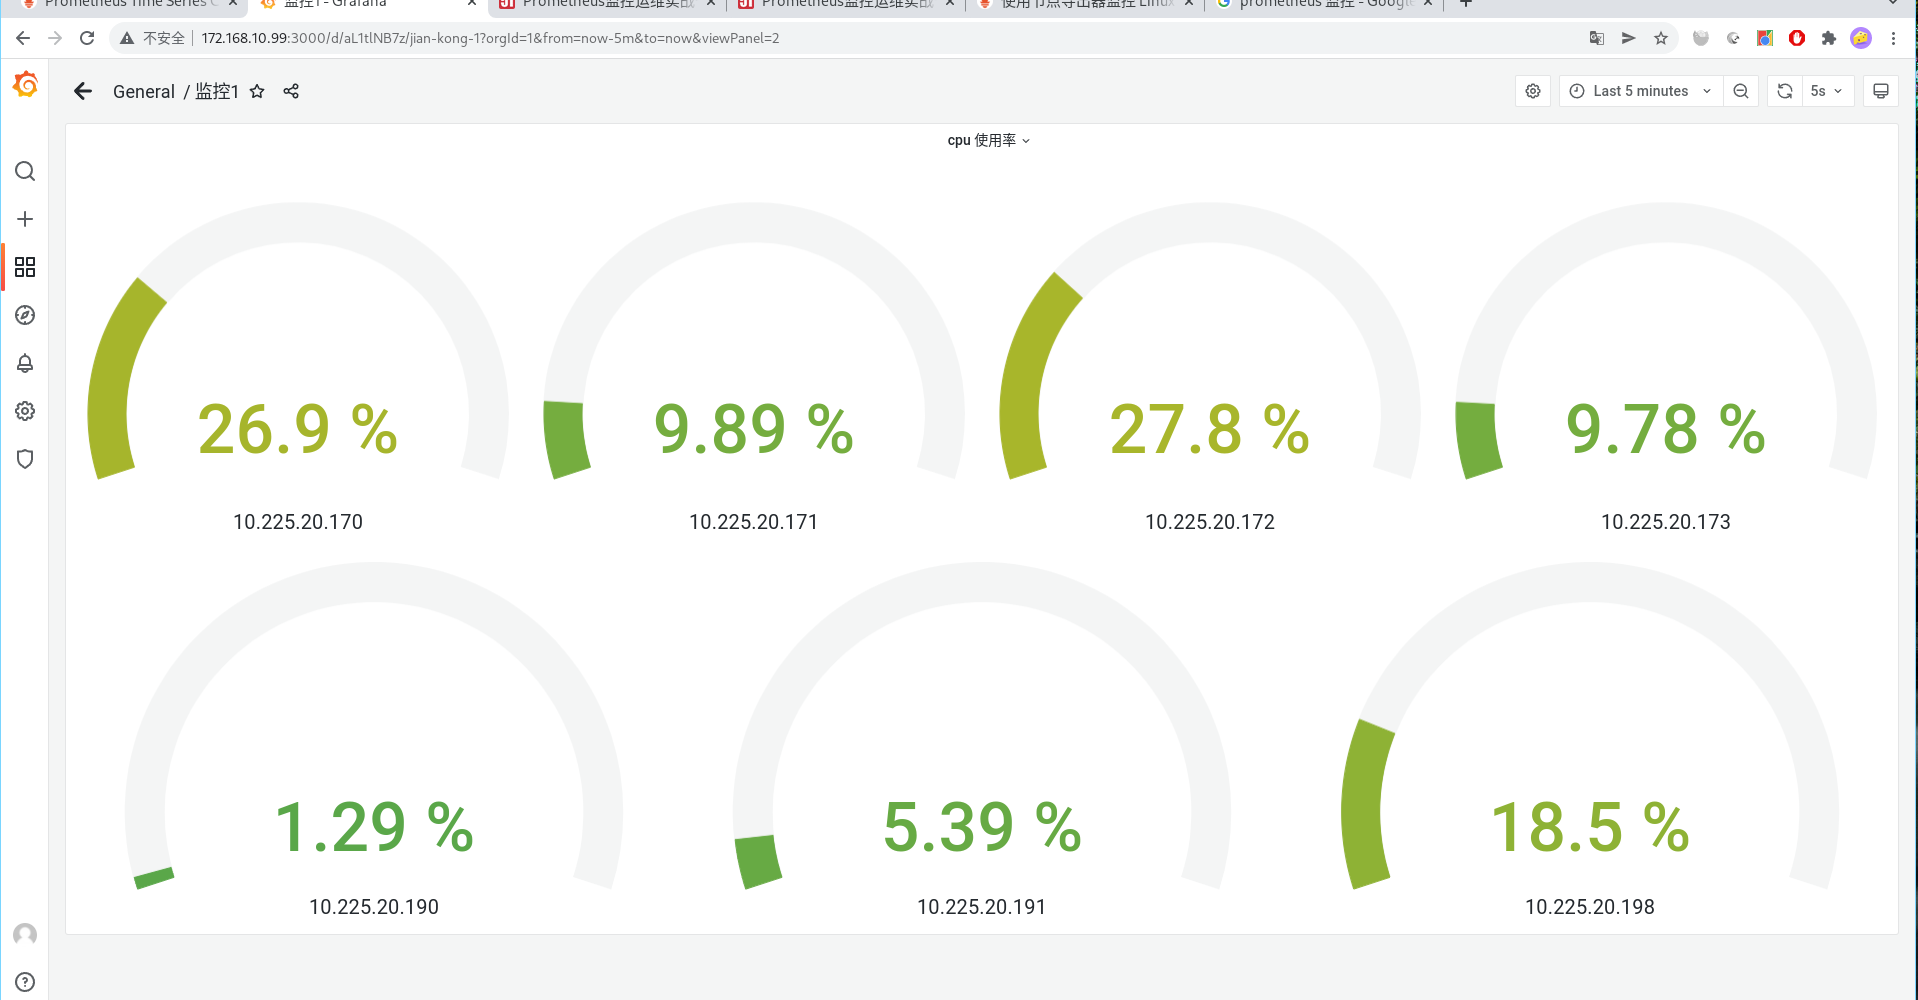
然后 配合 grafana 画出 图来
常用统计查询命令
-
场景: 你每5秒上报 一个平均值 ,比如你 每5秒 吃 10个馒头,然后 下五秒 吃 12 个馒头 , 我想统计 你 每 五分钟 要 吃多少个馒头 用
sum_over_time示例
sum_over_time(g20ck172_counter_kafaka_xdr_in[5m]),你想看 11:10 ~ 11:15 分钟 吃了多少馒头,鼠标应该悬浮到 11:15 就能看到 总数了

 浙公网安备 33010602011771号