matlab进度条显示
在日常matlab计算时候,考虑到计算漫长的等待,要是提前知道计算时长那该多好
测试代码
m=4;
n=3;
p=100;
progressbar('1','2','3')
for i=1:m
    for j=1:n
        for k=1:p
            pause(0.01)
            face3=k/p;
            face2=((j-1)+face3)/n;
            face1=((i-1)+face2)/m;
            progressbar(face1,face2,face3)
        end
    end
end
progressbar进度条函数
function progressbar(varargin)
% Description:
%   progressbar() provides an indication of the progress of some task using
% graphics and text. Calling progressbar repeatedly will update the figure and
% automatically estimate the amount of time remaining.
%   This implementation of progressbar is intended to be extremely simple to use
% while providing a high quality user experience.
%
% Features:
%   - Can add progressbar to existing m-files with a single line of code.
%   - Supports multiple bars in one figure to show progress of nested loops.
%   - Optional labels on bars.
%   - Figure closes automatically when task is complete.
%   - Only one figure can exist so old figures don't clutter the desktop.
%   - Remaining time estimate is accurate even if the figure gets closed.
%   - Minimal execution time. Won't slow down code.
%   - Randomized color. When a programmer gets bored...
%
% Example Function Calls For Single Bar Usage:
%   progressbar               % Initialize/reset
%   progressbar(0)            % Initialize/reset
%   progressbar('Label')      % Initialize/reset and label the bar
%   progressbar(0.5)          % Update
%   progressbar(1)            % Close
%
% Example Function Calls For Multi Bar Usage:
%   progressbar(0, 0)         % Initialize/reset two bars
%   progressbar('A', '')      % Initialize/reset two bars with one label
%   progressbar('', 'B')      % Initialize/reset two bars with one label
%   progressbar('A', 'B')     % Initialize/reset two bars with two labels
%   progressbar(0.3)          % Update 1st bar
%   progressbar(0.3, [])      % Update 1st bar
%   progressbar([], 0.3)      % Update 2nd bar
%   progressbar(0.7, 0.9)     % Update both bars
%   progressbar(1)            % Close
%   progressbar(1, [])        % Close
%   progressbar(1, 0.4)       % Close
%
% Notes:
%   For best results, call progressbar with all zero (or all string) inputs
% before any processing. This sets the proper starting time reference to
% calculate time remaining.
%   Bar color is choosen randomly when the figure is created or reset. Clicking
% the bar will cause a random color change.
%
% Demos:
%     % Single bar
%     m = 500;
%     progressbar % Init single bar
%     for i = 1:m
%       pause(0.01) % Do something important
%       progressbar(i/m) % Update progress bar
%     end
%
%     % Simple multi bar (update one bar at a time)
%     m = 4;
%     n = 3;
%     p = 100;
%     progressbar(0,0,0) % Init 3 bars
%     for i = 1:m
%         progressbar([],0) % Reset 2nd bar
%         for j = 1:n
%             progressbar([],[],0) % Reset 3rd bar
%             for k = 1:p
%                 pause(0.01) % Do something important
%                 progressbar([],[],k/p) % Update 3rd bar
%             end
%             progressbar([],j/n) % Update 2nd bar
%         end
%         progressbar(i/m) % Update 1st bar
%     end
%
%     % Fancy multi bar (use labels and update all bars at once)
%     m = 4;
%     n = 3;
%     p = 100;
%     progressbar('Monte Carlo Trials','Simulation','Component') % Init 3 bars
%     for i = 1:m
%         for j = 1:n
%             for k = 1:p
%                 pause(0.01) % Do something important
%                 % Update all bars
%                 frac3 = k/p;
%                 frac2 = ((j-1) + frac3) / n;
%                 frac1 = ((i-1) + frac2) / m;
%                 progressbar(frac1, frac2, frac3)
%             end
%         end
%     end
%
% Author:
%   Steve Hoelzer
%
% Revisions:
% 2002-Feb-27   Created function
% 2002-Mar-19   Updated title text order
% 2002-Apr-11   Use floor instead of round for percentdone
% 2002-Jun-06   Updated for speed using patch (Thanks to waitbar.m)
% 2002-Jun-19   Choose random patch color when a new figure is created
% 2002-Jun-24   Click on bar or axes to choose new random color
% 2002-Jun-27   Calc time left, reset progress bar when fractiondone == 0
% 2002-Jun-28   Remove extraText var, add position var
% 2002-Jul-18   fractiondone input is optional
% 2002-Jul-19   Allow position to specify screen coordinates
% 2002-Jul-22   Clear vars used in color change callback routine
% 2002-Jul-29   Position input is always specified in pixels
% 2002-Sep-09   Change order of title bar text
% 2003-Jun-13   Change 'min' to 'm' because of built in function 'min'
% 2003-Sep-08   Use callback for changing color instead of string
% 2003-Sep-10   Use persistent vars for speed, modify titlebarstr
% 2003-Sep-25   Correct titlebarstr for 0% case
% 2003-Nov-25   Clear all persistent vars when percentdone = 100
% 2004-Jan-22   Cleaner reset process, don't create figure if percentdone = 100
% 2004-Jan-27   Handle incorrect position input
% 2004-Feb-16   Minimum time interval between updates
% 2004-Apr-01   Cleaner process of enforcing minimum time interval
% 2004-Oct-08   Seperate function for timeleftstr, expand to include days
% 2004-Oct-20   Efficient if-else structure for sec2timestr
% 2006-Sep-11   Width is a multiple of height (don't stretch on widescreens)
% 2010-Sep-21   Major overhaul to support multiple bars and add labels
%

persistent progfig progdata lastupdate

% Get inputs
if nargin > 0
    input = varargin;
    ninput = nargin;
else
    % If no inputs, init with a single bar
    input = {0};
    ninput = 1;
end

% If task completed, close figure and clear vars, then exit
if input{1} == 1
    if ishandle(progfig)
        delete(progfig) % Close progress bar
    end
    clear progfig progdata lastupdate % Clear persistent vars
    drawnow
    return
end

% Init reset flag
resetflag = false;

% Set reset flag if first input is a string
if ischar(input{1})
    resetflag = true;
end

% Set reset flag if all inputs are zero
if input{1} == 0
    % If the quick check above passes, need to check all inputs
    if all([input{:}] == 0) && (length([input{:}]) == ninput)
        resetflag = true;
    end
end

% Set reset flag if more inputs than bars
if ninput > length(progdata)
    resetflag = true;
end

% If reset needed, close figure and forget old data
if resetflag
    if ishandle(progfig)
        delete(progfig) % Close progress bar
    end
    progfig = [];
    progdata = []; % Forget obsolete data
end

% Create new progress bar if needed
if ishandle(progfig)
else % This strange if-else works when progfig is empty (~ishandle() does not)

    % Define figure size and axes padding for the single bar case
    height = 0.03;
    width = height * 8;
    hpad = 0.02;
    vpad = 0.25;

    % Figure out how many bars to draw
    nbars = max(ninput, length(progdata));

    % Adjust figure size and axes padding for number of bars
    heightfactor = (1 - vpad) * nbars + vpad;
    height = height * heightfactor;
    vpad = vpad / heightfactor;

    % Initialize progress bar figure
    left = (1 - width) / 2;
    bottom = (1 - height) / 2;
    progfig = figure(...
        'Units', 'normalized',...
        'Position', [left bottom width height],...
        'NumberTitle', 'off',...
        'Resize', 'off',...
        'MenuBar', 'none' );

    % Initialize axes, patch, and text for each bar
    left = hpad;
    width = 1 - 2*hpad;
    vpadtotal = vpad * (nbars + 1);
    height = (1 - vpadtotal) / nbars;
    for ndx = 1:nbars
        % Create axes, patch, and text
        bottom = vpad + (vpad + height) * (nbars - ndx);
        progdata(ndx).progaxes = axes( ...
            'Position', [left bottom width height], ...
            'XLim', [0 1], ...
            'YLim', [0 1], ...
            'Box', 'on', ...
            'ytick', [], ...
            'xtick', [] );
        progdata(ndx).progpatch = patch( ...
            'XData', [0 0 0 0], ...
            'YData', [0 0 1 1] );
        progdata(ndx).progtext = text(0.99, 0.5, '', ...
            'HorizontalAlignment', 'Right', ...
            'FontUnits', 'Normalized', ...
            'FontSize', 0.7 );
        progdata(ndx).proglabel = text(0.01, 0.5, '', ...
            'HorizontalAlignment', 'Left', ...
            'FontUnits', 'Normalized', ...
            'FontSize', 0.7 );
        if ischar(input{ndx})
            set(progdata(ndx).proglabel, 'String', input{ndx})
            input{ndx} = 0;
        end

        % Set callbacks to change color on mouse click
        set(progdata(ndx).progaxes, 'ButtonDownFcn', {@changecolor, progdata(ndx).progpatch})
        set(progdata(ndx).progpatch, 'ButtonDownFcn', {@changecolor, progdata(ndx).progpatch})
        set(progdata(ndx).progtext, 'ButtonDownFcn', {@changecolor, progdata(ndx).progpatch})
        set(progdata(ndx).proglabel, 'ButtonDownFcn', {@changecolor, progdata(ndx).progpatch})

        % Pick a random color for this patch
        changecolor([], [], progdata(ndx).progpatch)

        % Set starting time reference
        if ~isfield(progdata(ndx), 'starttime') || isempty(progdata(ndx).starttime)
            progdata(ndx).starttime = clock;
        end
    end

    % Set time of last update to ensure a redraw
    lastupdate = clock - 1;

end

% Process inputs and update state of progdata
for ndx = 1:ninput
    if ~isempty(input{ndx})
        progdata(ndx).fractiondone = input{ndx};
        progdata(ndx).clock = clock;
    end
end

% Enforce a minimum time interval between graphics updates
myclock = clock;
if abs(myclock(6) - lastupdate(6)) < 0.01 % Could use etime() but this is faster
    return
end

% Update progress patch
for ndx = 1:length(progdata)
    set(progdata(ndx).progpatch, 'XData', ...
        [0, progdata(ndx).fractiondone, progdata(ndx).fractiondone, 0])
end

% Update progress text if there is more than one bar
if length(progdata) > 1
    for ndx = 1:length(progdata)
        set(progdata(ndx).progtext, 'String', ...
            sprintf('%1d%%', floor(100*progdata(ndx).fractiondone)))
    end
end

% Update progress figure title bar
if progdata(1).fractiondone > 0
    runtime = etime(progdata(1).clock, progdata(1).starttime);
    timeleft = runtime / progdata(1).fractiondone - runtime;
    timeleftstr = sec2timestr(timeleft);
    titlebarstr = sprintf('%2d%%    %s remaining', ...
        floor(100*progdata(1).fractiondone), timeleftstr);
else
    titlebarstr = ' 0%';
end
set(progfig, 'Name', titlebarstr)

% Force redraw to show changes
drawnow

% Record time of this update
lastupdate = clock;


% ------------------------------------------------------------------------------
function changecolor(h, e, progpatch) %#ok<INUSL>
% Change the color of the progress bar patch

% Prevent color from being too dark or too light
colormin = 1.5;
colormax = 2.8;

thiscolor = rand(1, 3);
while (sum(thiscolor) < colormin) || (sum(thiscolor) > colormax)
    thiscolor = rand(1, 3);
end

set(progpatch, 'FaceColor', thiscolor)


% ------------------------------------------------------------------------------
function timestr = sec2timestr(sec)
% Convert a time measurement from seconds into a human readable string.

% Convert seconds to other units
w = floor(sec/604800); % Weeks
sec = sec - w*604800;
d = floor(sec/86400); % Days
sec = sec - d*86400;
h = floor(sec/3600); % Hours
sec = sec - h*3600;
m = floor(sec/60); % Minutes
sec = sec - m*60;
s = floor(sec); % Seconds

% Create time string
if w > 0
    if w > 9
        timestr = sprintf('剩余:%d 周', w);
    else
        timestr = sprintf('剩余:%d 周, %d 天', w, d);
    end
elseif d > 0
    if d > 9
        timestr = sprintf('剩余:%d 天', d);
    else
        timestr = sprintf('剩余:%d 天, %d 小时', d, h);
    end
elseif h > 0
    if h > 9
        timestr = sprintf('剩余:%d 小时', h);
    else
        timestr = sprintf('剩余:%d 小时, %d 分钟', h, m);
    end
elseif m > 0
    if m > 9
        timestr = sprintf('剩余:%d 分', m);
    else
        timestr = sprintf('剩余:%d 分钟, %d 秒', m, s);
    end
else
    timestr = sprintf('剩余:%d 秒', s);
end
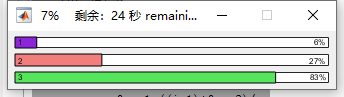
运行结果:

 浙公网安备 33010602011771号