
MATLAB|风玫瑰图
目录
刻度方向和长短设置,其中刻度方向有:'in'|'out'|'both'。
扫一扫关注公众号

效果图
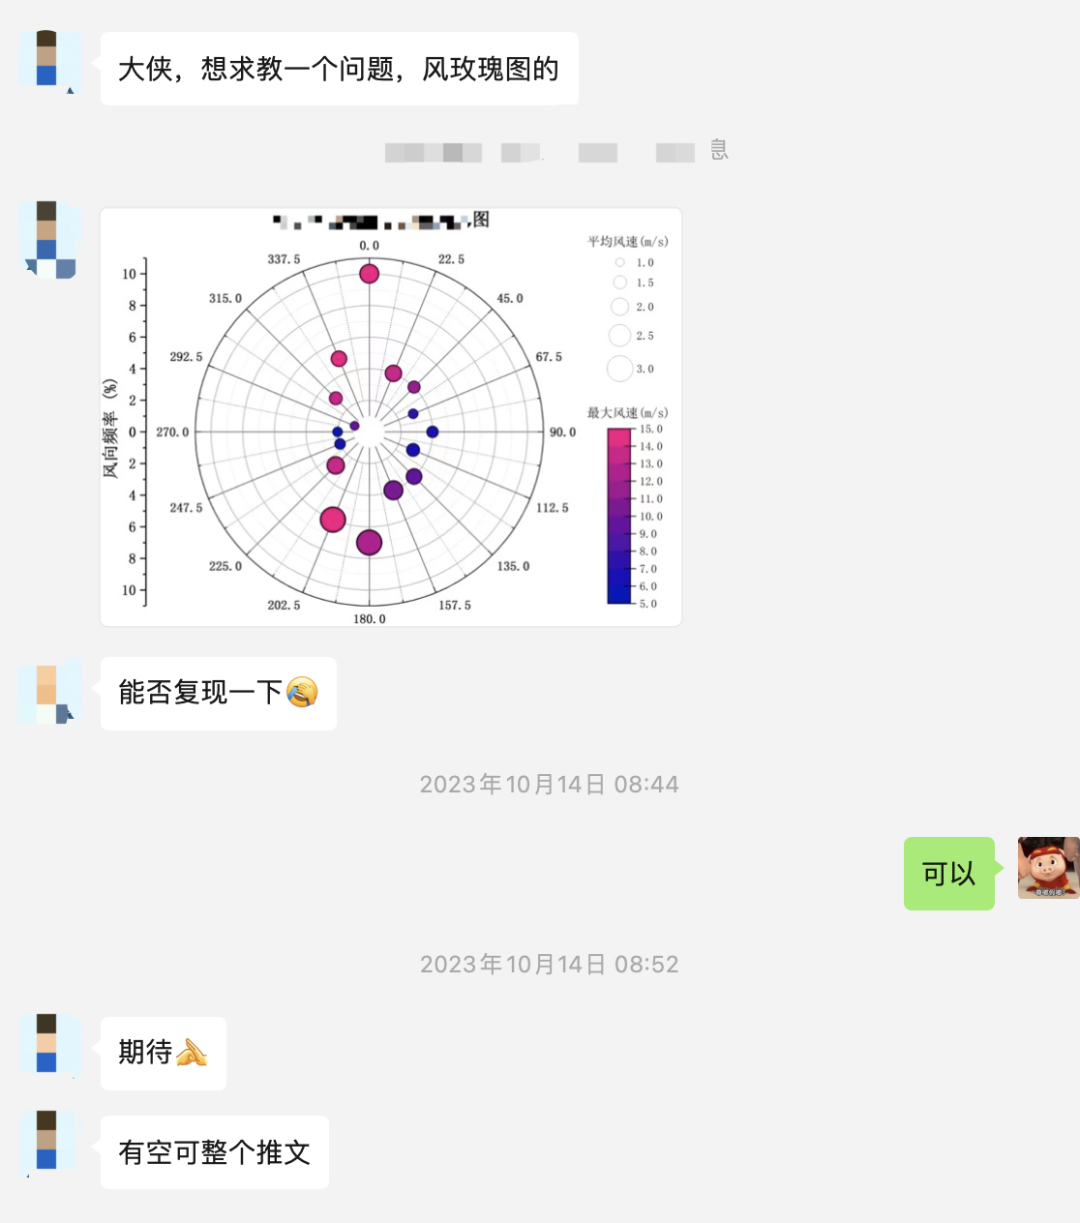
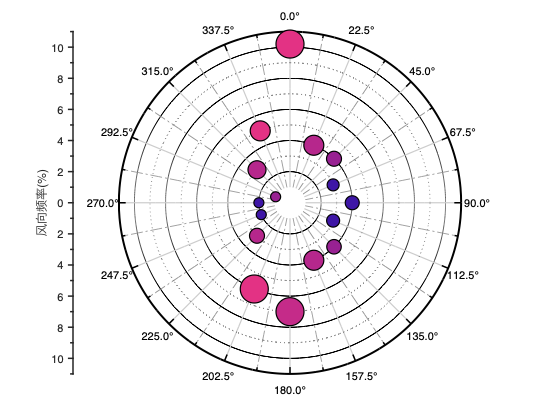
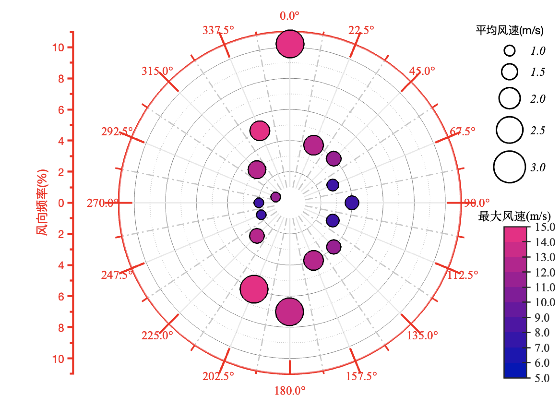
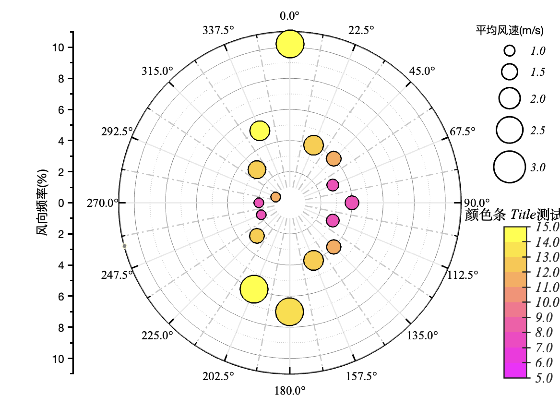
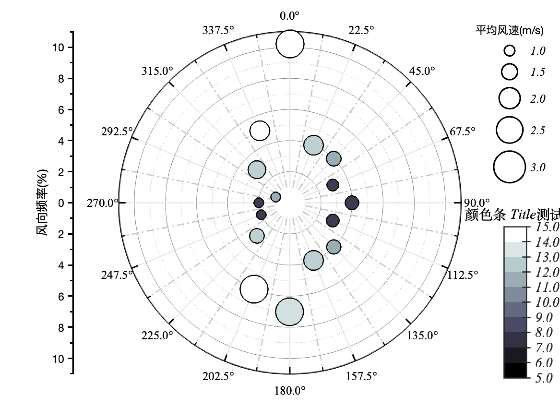
粉丝给的图:
复刻的图:
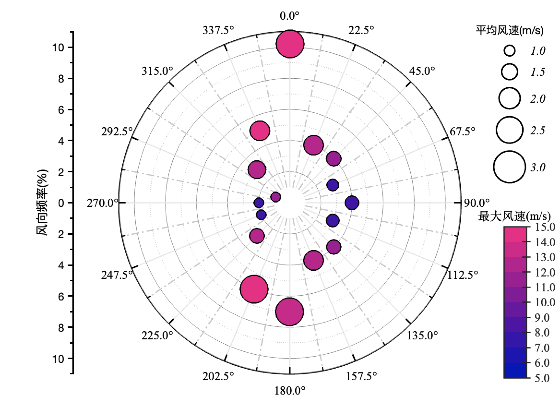
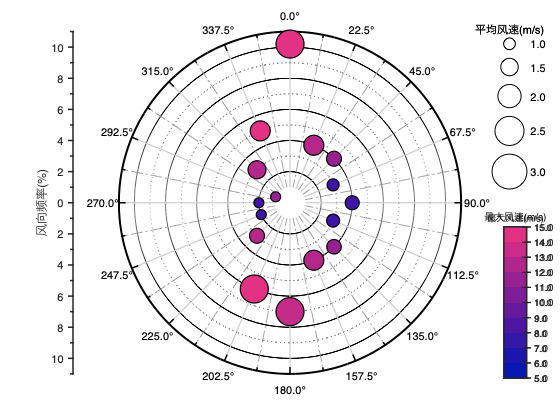
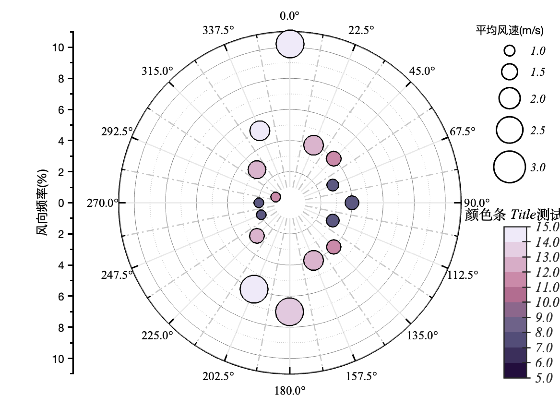
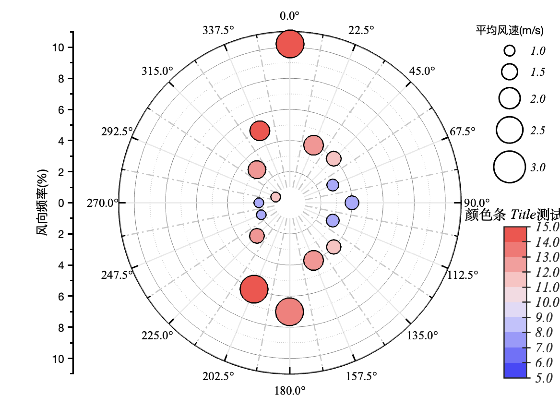
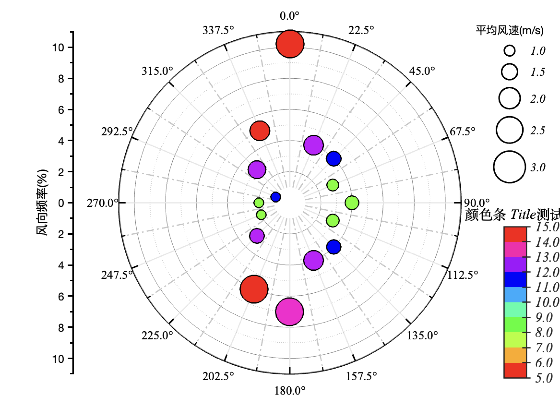
其他样式效果:
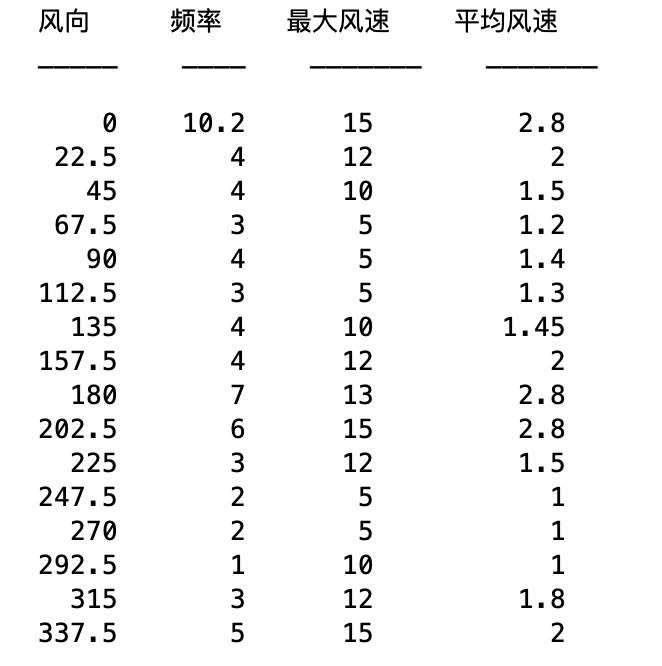
数据
数据包含:风向、刮风频率、最大风速、平均风速四个数据。
windDirections = [0.0, 22.5, 45.0, 67.5, 90.0, 112.5, 135.0, 157.5, 180.0, 202.5, 225.0, 247.5, 270.0, 292.5, 315.0, 337.5]';
windFrequency = [10.2, 4, 4, 3.0, 4.0, 3.0, 4.0, 4.0, 7.0, 6.0, 3, 2, 2, 1.0, 3, 5]';
maxWindSpeed = [15, 12, 10, 5, 5, 5,10, 12, 13, 15, 12,5, 5, 10, 12,  15]';
avgWindSpeed = [2.8, 2.0, 1.5, 1.2, 1.4, 1.3, 1.45, 2.00, 2.80, 2.80, 1.50, 1.00, 1.0, 1.0, 1.8, 2.0]';
data=[windDirections,windFrequency,maxWindSpeed,avgWindSpeed];
数据长成这样的
绘图教程
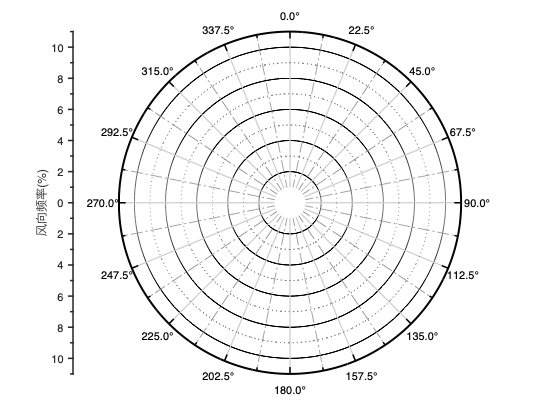
绘制左边Y轴
% 设置基础参数
maxRadius = ceil(max(windFrequency));
minRadius = round(maxRadius / 10);
dfT=unique(diff(windDirections));
allTheta = 0:0.01:360;
% 创建并配置坐标轴
fig=figure('Color',[1,1,1]);
ax = gca;
hold on; box off; grid off; axis equal;
ax.YLim = [-maxRadius, maxRadius];
ax.YMinorTick = 'on';
ax.XColor = 'none';
ax.XDir = 'normal';
ax.TickDir = 'out';
ax.LineWidth = 1.5;
majorTicksY = ax.YTick;
minorTicksY = (majorTicksY(1:end-1) + majorTicksY(2:end)) / 2;
diffTicks = unique(diff(majorTicksY));
maxRadius=max(ax.YTick)+diffTicks/2;
ax.YLim = [-maxRadius, maxRadius];%重新设定
ax.YAxis.MinorTickValues = [minorTicksY(1)-diffTicks, minorTicksY, minorTicksY(end)+diffTicks];
ax.YTickLabel = arrayfun(@(y) sprintf('%d', abs(y)), majorTicksY, 'UniformOutput', false);
ax.YLabel.String='风向频率(%)';

绘制主、次网格和主、次刻度的极坐标区域。
% 绘制主要的极坐标网格线
majorRadius = majorTicksY(majorTicksY > minRadius);
for i = 1:length(majorRadius)
    [xMajor, yMajor] = pol2cart(deg2rad(allTheta), majorRadius(i));
    plot(xMajor, yMajor, '-', 'Color', [0 0 0], 'LineWidth', 0.5);
end
majorTheta = windDirections;
fullRadius = linspace(minRadius, maxRadius, 1000);
for i = 1:length(majorTheta)
    [xMajorT, yMajorT] = pol2cart(deg2rad(majorTheta(i)), fullRadius);
    plot(xMajorT, yMajorT, '-', 'Color', [0.8 0.8 0.8], 'LineWidth', 1.2);
end
% 绘制次要的极坐标网格线
minorRadius = minorTicksY(minorTicksY > minRadius);
for i = 1:length(minorRadius)
    [xMinor, yMinor] = pol2cart(deg2rad(allTheta), minorRadius(i));
    plot(xMinor, yMinor, ':', 'Color', [0.55 0.55 0.55], 'LineWidth', 0.8);
end
minorTheta=windDirections+dfT/2;
% minorTheta = 11.25:22.5:360;
for i = 1:length(minorTheta)
    [xMinorT, yMinorT] = pol2cart(deg2rad(minorTheta(i)), fullRadius);
    plot(xMinorT, yMinorT, '-.', 'Color', [0.55 0.55 0.55]);
end
% 绘制最外层的极坐标线
[xOuter, yOuter] = pol2cart(deg2rad(allTheta), maxRadius);
plot(xOuter, yOuter, '-', 'Color', 'k', 'LineWidth', 2);
% 主刻度线
mainTickTheta= windDirections+dfT;
% mainTickTheta = 0:22.5:360;
tickRadius = [maxRadius*0.96, maxRadius];
for i = 1:length(mainTickTheta)
    [xMainTick, yMainTick] = pol2cart(deg2rad(mainTickTheta(i)), tickRadius);
    plot(xMainTick, yMainTick, '-', 'Color', [0, 0, 0], 'LineWidth', 1.5);
end
% 次刻度线
minorTickTheta=windDirections+dfT/2;
% minorTickTheta = 11.25:22.5:360;
tickRadiusMinor = [maxRadius*0.98, maxRadius];
for i = 1:length(minorTickTheta)
    [xMinorTick, yMinorTick] = pol2cart(deg2rad(minorTickTheta(i)), tickRadiusMinor);
    plot(xMinorTick, yMinorTick, '-', 'Color', [0 0 0], 'LineWidth', 1.5);
end
% 添加主刻度外的标签
labelDist = maxRadius *(1+ 0.094); % 设定标签距离为最大半径(1+ 0.094),可以根据需要进行调整
for i = 1:length(majorTheta)
    adjustedAngle = majorTheta(i); % 从正北方开始,并且顺时针增加 % 从正北方开始,并且顺时针增加
    angle = mod(adjustedAngle, 360); % 确保角度在0-360之间
    [xLabel, yLabel] = pol2cart(deg2rad(90-adjustedAngle), labelDist);
    labelText = sprintf('%.1f°', angle);
    text(xLabel, yLabel, labelText, 'HorizontalAlignment', 'center', 'VerticalAlignment', 'middle');
end
添加刮风数据,添加数据和颜色、图列大小映射关系。
adjustedWindDirections = 360 - windDirections;
[xWind, yWind] = pol2cart(deg2rad(adjustedWindDirections + 90), windFrequency);
colorGradient = [0.0078, 0.0941, 0.7333; 0.9725, 0.0039, 0.5216];
colorMapMajor = makeColorMap(colorGradient, length(windDirections));
% 根据风速大小对颜色进行排序
[~, idx] = sort(maxWindSpeed, 'Ascend');
sortedColorMap = colorMapMajor(idx, :);
% 对于相同的风速值,使用第一个出现的颜色值为其赋色
uniqueSpeeds = unique(maxWindSpeed, 'stable');
for i = 1:length(uniqueSpeeds)
    currentSpeed = uniqueSpeeds(i);
    indices = find(maxWindSpeed == currentSpeed);
    if length(indices) > 1
        sortedColorMap(indices, :) = repmat(sortedColorMap(indices(1), :), length(indices), 1);
    end
end
maxWind = max(maxWindSpeed);
desiredMaxSize=max(avgWindSpeed);
desiredMinSize=min(avgWindSpeed);
for i = 1:length(windDirections)
    color = getColorForSpeed(maxWindSpeed(i), maxWind , colorMapMajor);
    s = mapToMarkerSize(avgWindSpeed(i), desiredMaxSize, desiredMinSize);
    plot(xWind(i), yWind(i), 'o', 'LineWidth', 1.2, 'MarkerSize',s, ...
        'MarkerEdgeColor', 'k', 'MarkerFaceColor', color);
end
颜色条绘制
colorMapMinor = makeColorMap(colorGradient, 10);
colormap(colorMapMinor);
cBar = colorbar;
cBar.Position = [.9 .1 .04 .36];
cBar.LineWidth = 1.2;
cBar.TickLength = 0.025;
cBar.Ticks = linspace(floor(min(maxWindSpeed)),ceil(max(maxWindSpeed)),11);
% cBar.Ticks =linspace(minWindSpeed, maxWindSpeed, 11);
tickLabels = arrayfun(@(x) sprintf('%.1f', x), cBar.Ticks, 'UniformOutput', false);
cBar.TickLabels = tickLabels;
cBar.TickDirection = 'both';
colorBarTitle = title(cBar, '最大风速(m/s)');
caxis([floor(min(maxWindSpeed)),ceil(max(maxWindSpeed))]);
AxSize=axes(fig,'Position',[.86 0.55 .1 .36],'Color',[1,1,1]);
title(AxSize,'平均风速(m/s)')
AxSize.XColor='none';
AxSize.YColor='none';
meanRLabel=linspace(ceil(0.3),ceil(2.6),5);

添加图列绘制
% 定义半径和距离
legR=linspace(ceil(min(avgWindSpeed)),ceil(max(avgWindSpeed)),5);
d =ceil(ceil(max(avgWindSpeed))/2);
% 计算每个圆的中心位置
legY = zeros(1, length(legR));
totalHeight = sum(2.*legR) + d*(length(legR)-1);
legY(1) = totalHeight/2 - legR(1);
for i = 2:length(legR)
    legY(i) = legY(i-1) - 2*legR(i-1) - d;
end
% 绘制圆形
hold on;
for i = 1:length(legR)
    rectangle('Position',[-legR(i), legY(i)-legR(i), 2*legR(i), 2*legR(i)], 'Curvature', [1, 1],'LineWidth',1);
    text(max(legR) + 0.6, legY(i), sprintf('%.1f', legR(i)));
end
axis equal;
xlim([-max(legR) max(legR)]);
ylim([legY(end)-legR(end) legY(1)+legR(1)]);
hold off;
绘图工具箱介绍
默认绘图
figure('name','默认绘图')
w=WindRosePlot(data);
w.plot();
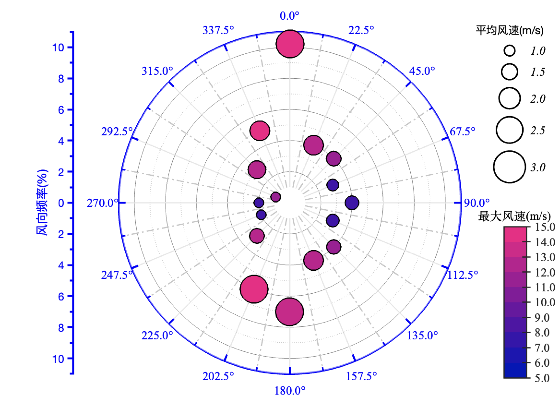
刻度颜色设置
figure('name','设置刻度颜色')
w=WindRosePlot(data);
w.AxisColor=[0,0,1];
w.AxisLineWidth=2;
w.plot();
刻度方向和长短设置,其中刻度方向有:'in'|'out'|'both'。
figure('name','设置刻度方向、长短')
w=WindRosePlot(data);
w.AxisMainTickDir='both';
w.AxisMinorTickDir='out';
w.AxisColor=[1,0,0];
w.AxisLineWidth=2;
w.AxisTickLength=0.08;
w.plot();
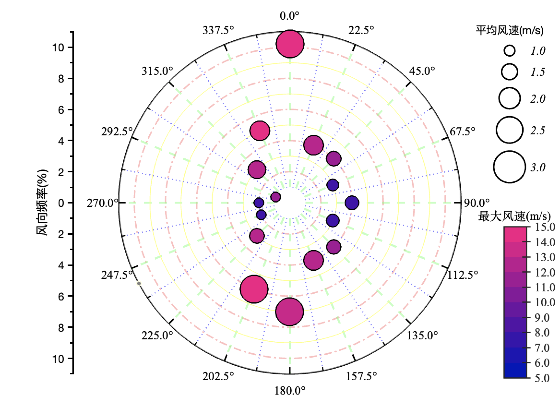
网格设置:主、次网格的颜色、粗细、透明度设置。
figure('name','主、次网格样式、颜色、粗细、透明度')
w=WindRosePlot(data);
w.RGrid='on';
w.RGridLineStyle='-.';
w.RGridColor=[1,0,0];
w.RGridAlpha=0.5;
w.RGridLineWidth=1.5;

w.ThetaGrid='on';
w.ThetaGridLineStyle='--';
w.ThetaGridColor=[0,1,0];
w.ThetaGridAlpha=0.5;
w.ThetaGridLineWidth=2;

w.MinorRGrid='on';
w.MinorRGridLineStyle='-';
w.MinorRGridColor=[1,1,0];

w.MinorThetaGrid='on';
w.MinorThetaGridLineStyle=':';
w.MinorThetaGridColor=[0,0,1];
w.plot();
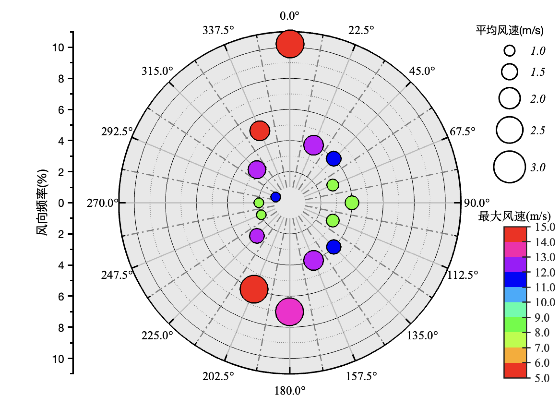
背景颜色设置
figure('name','背景颜色')
w=WindRosePlot(data);
w.ColorMaps=hsv;
w.AxisBackgroundColor=[1,1,1]*0.10;
w.AxisFaceAlpha=0.1;
w.plot();
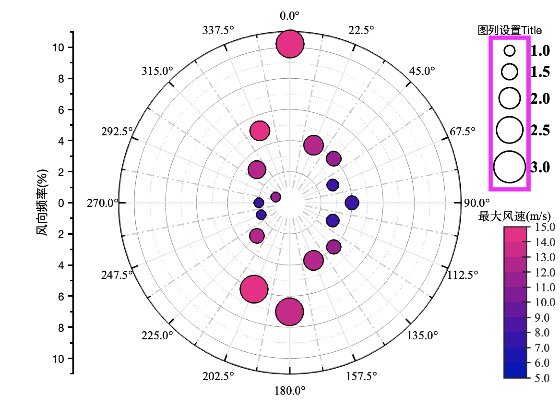
图列设置
figure('name','图列设置:title设置、背景色、边缘色、边缘粗细、字体属性')
w=WindRosePlot(data);
w.LegendTitle='图列设置Title';
w.LegendBackgroundColor=[1,.9,.8]*.98;
w.LegendEdgeColor='m';
w.LegendLineWidth=4;
w.LegendFontName='Times new Roman';
w.LegendFontSize=16;
w.LegendFontAngle='normal';
w.LegendFontWeight='bold';%加粗
w.plot();
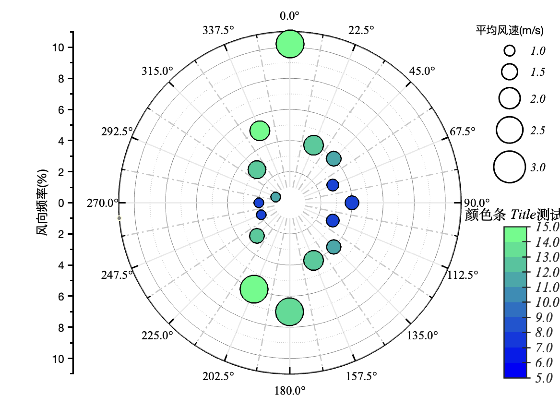
颜色条设置
figure('name','颜色条设置')
w=WindRosePlot(data);
% load('colorsData/acton100.mat')
% load('colorsData/bwr.mat')
% load('colorsData/vikO100.mat')
% w.ColorMaps=colorsList;
% w.ColorMaps=hsv;
% w.ColorMaps=bone;
% w.ColorMaps=jet;
% w.ColorMaps=winter;
w.ColorMaps=spring;
w.ColorMapsTitle='颜色条 Title测试';
w.ColorMapsFontSize=14;
w.ColorMapsFontAngle='italic';
w.plot();|
|
|
|
|
|
|
|
WindRosePlot类函数
收藏=学会
classdef WindRosePlot
    % ------------------------------------------------
    %  @Author:  好玩的 MATLAB.
    %  @E-mail:  2377389590@qq.com
    %  @WeChat:  idmatlab
    %  @Date:    Oct 30, 2023.
    %  @Version: Matlab R2022b.
    %  % #Respect the fruits of labor. Please note the tweet link and official account name when reprinting. Commercial use is strictly prohibited.
    %  Example:
    %     windDirections = [0.0, 22.5, 45.0, 67.5, 90.0, 112.5, 135.0, 157.5, 180.0, 202.5, 225.0, 247.5, 270.0, 292.5, 315.0, 337.5]';
    %     windFrequency = [10.2, 4, 4, 3.0, 4.0, 3.0, 4.0, 4.0, 7.0, 6.0, 3, 2, 2, 1.0, 3, 5]';
    %     maxWindSpeed = [15, 12, 10, 5, 5, 5,10, 12, 13, 15, 12,5, 5, 10, 12,  15]';
    %     avgWindSpeed = [2.8, 2.0, 1.5, 1.2, 1.4, 1.3, 1.45, 2.00, 2.80, 2.80, 1.50, 1.00, 1.0, 1.0, 1.8, 2.0]';
    %     % dataT = table(windDirections, windFrequency, maxWindSpeed, avgWindSpeed, 'VariableNames', {'风向', '频率', '最大风速', '平均风速'});
    %     data=[windDirections,windFrequency,maxWindSpeed,avgWindSpeed];
    %     w=WindRosePlot(data);
    %     w.plot();
    %-------------------------------------------------
    properties
        fig
        %
        WindDirections;     %风向
        WindFrequency;      %刮风频率
        MaxWindSpeed;       %最大风速
        AvgWindSpeed;       %平均风速
        %
        RGrid='on';         %显示主 r 轴网格线
        ThetaGrid='on';     %显示主 Theta 轴网格线
        MinorRGrid='on';    %显示次 r 轴网格线
        MinorThetaGrid='on';%显示次 Theta 轴网格线
        %
        YLabel='风向频率(%)';
        %  R主网格样式
        RGridLineStyle='-';
        RGridColor=[0,0,0];
        RGridAlpha=1;
        RGridLineWidth=0.5;
        % Theta 主网格样式
        ThetaGridLineStyle='-';
        ThetaGridColor=[0.8 0.8 0.8];
        ThetaGridAlpha=1;
        ThetaGridLineWidth=1.2;
        % R次网格样式
        MinorRGridLineStyle=':';
        MinorRGridColor=[0.55 0.55 0.55];
        MinorRGridAlpha=1;
        MinorRGridLineWidth=0.8;
        % Theta 次网格样式
        MinorThetaGridLineStyle='-.'
        MinorThetaGridColor=[0.55 0.55 0.55];
        MinorThetaGridAlpha=1;
        MinorThetaGridLineWidth=1.2;
        % 刻度样式
        AxisColor=[0,0,0];
        AxisLineWidth=1.5;
        AxisMainTickDir='in';
        AxisMinorTickDir='in';
        AxisTickLength=0.04;
        AxisTickFontSize=12;
        AxisTickFontWeight='normal'%'normal'|'bold'
        AxisTickFontName='Times new Roman';
        AxisFaceAlpha=0.5;
        AxisBackgroundColor=[1,1,1];
        % 颜色条
        ColorMaps=[0.0078, 0.0941, 0.7333; 0.9725, 0.0039, 0.5216];
        ColorMapsTitle='最大风速(m/s)';
        ColorMapsFontName='Times new Roman';
        ColorMapsFontSize=12;
        ColorMapsFontAngle='normal';%'normal' | 'italic'。
        ColorMapsFontWeight='normal'; %'normal'|'bold'
        %legend 图列
        LegendTitle='平均风速(m/s)';
        LegendBackgroundColor=[1,1,1]*.95;
        LegendEdgeColor='none';
        LegendLineWidth=1;
        LegendFontName='Times new Roman';
        LegendFontAngle='italic';%'normal' | 'italic'。
        LegendFontSize=12;
        LegendFontWeight='normal';
        LegendRotation=0;
    end
    methods
        function  obj =WindRosePlot(data)
            obj.fig=gcf;
            obj.fig.Color=[1,1,1];
            obj.WindDirections = data(:,1);
            obj.WindFrequency = data(:,2);
            obj.MaxWindSpeed = data(:,3);
            obj.AvgWindSpeed =data(:,4);
            %-------------------------
            obj.RGrid='on';         obj.RGridLineStyle='-';          obj.RGridColor=[0,0,0];                  obj.RGridAlpha=1;         obj.RGridLineWidth=0.5;
            obj.ThetaGrid='on';     obj.ThetaGridLineStyle='-';      obj.ThetaGridColor=[0.8 0.8 0.8];        obj.ThetaGridAlpha=1;     obj.ThetaGridLineWidth=1.2;
            obj.MinorRGrid='on';    obj.MinorRGridLineStyle=':';     obj.MinorRGridColor=[0.55 0.55 0.55];    obj.MinorRGridAlpha=1;    obj.MinorRGridLineWidth=0.8;
            obj.MinorThetaGrid='on';obj.MinorThetaGridLineStyle='-.';obj.MinorThetaGridColor=[0.55 0.55 0.55];obj.MinorThetaGridAlpha=1;obj.MinorThetaGridLineWidth=1.2;
            obj.ColorMaps = [0.0078, 0.0941, 0.7333; 0.9725, 0.0039, 0.5216];
        end
        function plot(obj)
            maxRadius = ceil(max(obj.WindFrequency));
            minRadius = round(maxRadius / 10);
            dfT=unique(diff(obj.WindDirections));
            allTheta = 0:0.01:360;
            ax = gca;
            hold on; box off; grid off; axis equal;
            ax.YLim = [-maxRadius, maxRadius];
            ax.YMinorTick = 'on';
            ax.XColor = 'none';
            ax.XDir = 'normal';
            ax.TickDir = 'out';
            ax.LineWidth = obj.AxisLineWidth;
            ax.YColor=obj.AxisColor;
            majorTicksY = ax.YTick;
            minorTicksY = (majorTicksY(1:end-1) + majorTicksY(2:end)) / 2;
            diffTicks = unique(diff(majorTicksY));
            maxRadius=max(ax.YTick)+diffTicks/2;
            ax.YLim = [-maxRadius, maxRadius];%重新设定
            ax.YAxis.MinorTickValues = [minorTicksY(1)-diffTicks, minorTicksY, minorTicksY(end)+diffTicks];
            ax.YTickLabel = arrayfun(@(y) sprintf('%d', abs(y)), majorTicksY, 'UniformOutput', false);
            ax.YLabel.String=obj.YLabel;
            % =============绘制主要R Theta的极坐标网格线===============================
            %  # RGrid
            majorRadius = majorTicksY(majorTicksY > minRadius);
            if strcmpi(obj.RGrid,'on')
                for i = 1:length(majorRadius)
                    [xMajor, yMajor] = pol2cart(deg2rad(allTheta), majorRadius(i));
                    plot(xMajor, yMajor,'LineStyle',obj.RGridLineStyle,'Color', [obj.RGridColor obj.RGridAlpha], 'LineWidth',obj.RGridLineWidth);
                end
            elseif strcmpi(obj.RGrid,'off')
            end
            %   # ThetaGrid
            majorTheta = obj.WindDirections;
            fullRadius = linspace(minRadius, maxRadius, 1000);
            if strcmpi(obj.ThetaGrid,'on')
                for i = 1:length(majorTheta)
                    [xMajorT, yMajorT] = pol2cart(deg2rad(majorTheta(i)), fullRadius);
                    plot(xMajorT, yMajorT, 'LineStyle',obj.ThetaGridLineStyle, 'Color', [obj.ThetaGridColor obj.ThetaGridAlpha], 'LineWidth', obj.ThetaGridLineWidth);
                end
            elseif  strcmpi(obj.ThetaGrid,'off')
            end
            % 绘制次要R Theta的极坐标网格线
            %   # MinorRGrid
            if strcmpi(obj.MinorRGrid,'on')
                minorRadius = minorTicksY(minorTicksY > minRadius);
                for i = 1:length(minorRadius)
                    [xMinor, yMinor] = pol2cart(deg2rad(allTheta), minorRadius(i));
                    plot(xMinor, yMinor, 'LineStyle',obj.MinorRGridLineStyle,'Color', [obj.MinorRGridColor obj.MinorRGridAlpha], 'LineWidth',obj.MinorRGridLineWidth);
                end
            elseif strcmpi(obj.MinorRGrid,'off')
            end
            %   # MinorThetaGrid
            minorTheta=obj.WindDirections+dfT/2;
            if strcmpi(obj.MinorThetaGrid,'on')
                for i = 1:length(minorTheta)
                    [xMinorT, yMinorT] = pol2cart(deg2rad(minorTheta(i)), fullRadius);
                    plot(xMinorT, yMinorT, 'LineStyle',obj.MinorThetaGridLineStyle, 'Color', [obj.MinorThetaGridColor obj.MinorThetaGridAlpha], 'LineWidth', obj.MinorThetaGridLineWidth);
                end
            elseif strcmpi(obj.MinorThetaGrid,'off')
            end
            % ===================绘制刻度===============================
            % 绘制最外层的极坐标线
            [xOuter, yOuter] = pol2cart(deg2rad(allTheta), max(ax.YTick)+diffTicks/2);
            plot(xOuter, yOuter, '-', 'Color',obj.AxisColor, 'LineWidth', obj.AxisLineWidth);
            fill(xOuter, yOuter,obj.AxisBackgroundColor,'EdgeColor','none','FaceAlpha',obj.AxisFaceAlpha)
            % #主刻度
            if obj.AxisTickLength > 1 || obj.AxisTickLength <= 0
                error('TickLength must be less than 1 and greater than 0.');
            end
            if strcmpi(obj.AxisMainTickDir,'in')
                tickRadius = [maxRadius*(1-obj.AxisTickLength), maxRadius];
            elseif strcmpi(obj.AxisMainTickDir,'out')
                tickRadius = [ maxRadius,maxRadius*(1+obj.AxisTickLength)];
            elseif strcmpi(obj.AxisMainTickDir,'both')
                tickRadius = [maxRadius*(1-obj.AxisTickLength) maxRadius*(1+obj.AxisTickLength)];
            else
                error('Invalid value for mainTickDir. It should be "in", "out", or "both".');
            end
            mainTickTheta= obj.WindDirections+dfT;
            for i = 1:length(mainTickTheta)
                [xMainTick, yMainTick] = pol2cart(deg2rad(mainTickTheta(i)), tickRadius);
                plot(xMainTick, yMainTick, '-', 'Color', obj.AxisColor, 'LineWidth', obj.AxisLineWidth);
            end
            disp(char([20844 20247 21495 58 22909 29609 30340 77 97 116 108 97 98]))
            % #次刻度
            if strcmpi(obj.AxisMinorTickDir,'in')
                tickRadiusMinor = [maxRadius*(1-obj.AxisTickLength/2), maxRadius];
            elseif strcmpi(obj.AxisMinorTickDir,'out')
                tickRadiusMinor = [ maxRadius maxRadius*(1+obj.AxisTickLength/2)];
            elseif strcmpi(obj.AxisMinorTickDir,'both')
                tickRadiusMinor = [maxRadius*(1-obj.AxisTickLength/2), maxRadius*(1+obj.AxisTickLength/2)];
            else
                error('Invalid value for mainTickDir. It should be "in", "out", or "both".');
            end
            minorTickTheta=obj.WindDirections+dfT/2;
            for i = 1:length(minorTickTheta)
                [xMinorTick, yMinorTick] = pol2cart(deg2rad(minorTickTheta(i)), tickRadiusMinor);
                plot(xMinorTick, yMinorTick, '-', 'Color', obj.AxisColor, 'LineWidth', obj.AxisLineWidth*0.8);
            end
            % ==========添加主刻度外的标签===========================
            labelDist = maxRadius *(1+ 0.094); % 设定标签距离为最大半径(1+ 0.094),可以根据需要进行调整
            for i = 1:length(majorTheta)
                adjustedAngle = majorTheta(i); % 从正北方开始,并且顺时针增加 % 从正北方开始,并且顺时针增加
                angle = mod(adjustedAngle, 360); % 确保角度在0-360之间
                [xLabel, yLabel] = pol2cart(deg2rad(90-adjustedAngle), labelDist);
                labelText = sprintf('%.1f°', angle);
                text(xLabel, yLabel, labelText, 'HorizontalAlignment', 'center', ...
                    'VerticalAlignment', 'middle', ...
                    'FontSize',obj.AxisTickFontSize,'FontWeight',obj.AxisTickFontWeight,'FontName',obj.AxisTickFontName, ...
                    'Color',obj.AxisColor);
            end
            %==================添加数据========================
            adjustedWindDirections = 360 - obj.WindDirections;
            [xWind, yWind] = pol2cart(deg2rad(adjustedWindDirections + 90), obj.WindFrequency);
            colorMapMajor = obj.makeColorMap(obj.ColorMaps, length(obj.WindDirections));
            % 根据风速大小对颜色进行排序
            [~, idx] = sort(obj.MaxWindSpeed, 'Ascend');
            sortedColorMap = colorMapMajor(idx, :);
            %对于相同的风速值,使用第一个出现的颜色值为其赋色
            uniqueSpeeds = unique(obj.MaxWindSpeed, 'stable');
            for i = 1:length(uniqueSpeeds)
                currentSpeed = uniqueSpeeds(i);
                indices = find(obj.MaxWindSpeed == currentSpeed);
                if length(indices) > 1
                    sortedColorMap(indices, :) = repmat(sortedColorMap(indices(1), :), length(indices), 1);
                end
            end
            maxWind = max(obj.MaxWindSpeed);
            desiredMaxSize=max(obj.AvgWindSpeed);
            desiredMinSize=min(obj.AvgWindSpeed);
            for i = 1:length(obj.WindDirections)
                color = obj.getColorForSpeed(obj.MaxWindSpeed(i), maxWind , colorMapMajor);
                s = obj.mapToMarkerSize(obj.AvgWindSpeed(i), desiredMaxSize, desiredMinSize);
                plot(xWind(i), yWind(i), 'o', 'LineWidth', 1.2, 'MarkerSize',s,...
                    'MarkerEdgeColor', 'k', 'MarkerFaceColor', color);
            end
            % ================添加 colorbar======================================
            colorMapMinor = obj.makeColorMap(obj.ColorMaps, 10);
            colormap(colorMapMinor);
            cBar = colorbar;
            cBar.Position = [.9 .1 .04 .36];
            cBar.LineWidth = 1.2;
            cBar.TickLength = 0.025;
            cBar.Ticks = linspace(floor(min(obj.MaxWindSpeed)),ceil(max(obj.MaxWindSpeed)),11);
            tickLabels = arrayfun(@(x) sprintf('%.1f', x), cBar.Ticks, 'UniformOutput', false);
            cBar.TickLabels = tickLabels;
            cBar.TickDirection = 'both';
            caxis([floor(min(obj.MaxWindSpeed)),ceil(max(obj.MaxWindSpeed))]);
            title(cBar, obj.ColorMapsTitle);
            cBar.FontName= obj.ColorMapsFontName;
            cBar.FontSize=obj.ColorMapsFontSize;
            cBar.FontAngle= obj.ColorMapsFontAngle;
            cBar.FontWeight=obj.ColorMapsFontWeight; %'normal'|'bold'
            % ===============添加 Legend=======================================
            legAx=axes(obj.fig,'Position',[.86 0.55 .1 .36],'Color',[1,1,1],'Box','on');
            title(legAx,obj.LegendTitle)
            legAx.Color=obj.LegendBackgroundColor;
            legAx.XColor=obj.LegendEdgeColor;legAx.YColor=obj.LegendEdgeColor;
            legAx.XTick=[];legAx.YTick=[];
            legAx.TickLength=[0 0];
            legAx.LineWidth=obj.LegendLineWidth;

            % 定义半径和距离
            legR=linspace(ceil(min(obj.AvgWindSpeed)),ceil(max(obj.AvgWindSpeed)),5);
            d =ceil(ceil(max(obj.AvgWindSpeed))/2);
            legY = zeros(1, length(legR));
            totalHeight = sum(2.*legR) + d*(length(legR)-1);
            legY(1) = totalHeight/2 - legR(1);
            for i = 2:length(legR)
                legY(i) = legY(i-1) - 2*legR(i-1) - d;
            end
            % 绘制圆形
            hold on;
            for i = 1:length(legR)
                rectangle('Position',[-legR(i), legY(i)-legR(i), 2*legR(i), 2*legR(i)], 'Curvature', [1, 1],'LineWidth',1.5,'FaceColor', 'white');
                text(max(legR) + 0.9, legY(i), sprintf('%.1f', legR(i)), ...
                    "FontName",obj.LegendFontName,"FontSize",obj. LegendFontSize,'FontAngle',obj.LegendFontAngle, ...
                    'FontWeight',obj.LegendFontWeight,'Rotation',obj.LegendRotation);
            end
            axis equal;
            xlim([-max(legR)*1.2 max(legR)*1.2]);
            ylim([(legY(end)-legR(end))*1.1 (legY(1)+legR(1))*1.1]);
            hold off;
        end
    end
    methods(Access=private)
        function color = getColorForSpeed(obj,speed, maxSpeed, colorMap)
            idx = round((speed / maxSpeed) * size(colorMap, 1));
            idx = min(max(idx, 1), size(colorMap, 1)); % 保证idx在正确的范围内
            color = colorMap(idx, :);
        end
        function s = mapToMarkerSize(obj,speed, maxSize, minSize)
            normalized = (speed - minSize)/(maxSize -minSize);
            s = minSize + normalized * (maxSize - minSize);
            s=s*10;
        end
        function cMap=makeColorMap(obj,colorlist,num)
            color.Num= num;
            color.list=colorlist;
            for col=1:size(color.list,2)
                x=1:size(color.list,1);
                xi=linspace(1,size(color.list,1),color.Num);
                color.map(:,col)=interp1(x,color.list(:,col),xi);
            end
            cMap=color.map;
        end
    end
end
属性:
-
fig:存储图形的句柄。
-
WindDirections:风向数据。
-
WindFrequency:刮风频率。
-
MaxWindSpeed:最大风速数据。
-
AvgWindSpeed:平均风速数据。
-
RGrid,ThetaGrid,MinorRGrid,MinorThetaGrid:这些属性用于控制是否显示对应的网格线。
-
YLabel:Y轴标签。
-
还有许多其他的属性,例如RGridLineStyle,RGridColor等,用于控制图形的样式和外观。
方法:
-
构造函数WindRosePlot:当创建WindRosePlot类的对象时,此构造函数将被调用。构造函数接收风玫瑰数据作为输入,并初始化类的属性。此外,还设置了默认的图形样式。
-
plot方法:这个方法用于绘制风玫瑰图。它首先设置坐标轴和极坐标的属性。接下来,它会绘制主要和次要的R和Theta网格线。然后,它绘制刻度。

 浙公网安备 33010602011771号