
MATLAB|热力日历图
目录

日历图介绍:
热力日历图是一种数据可视化形式,它结合了传统日历的布局和热力图的颜色编码系统,用来表示时间序列数据的强度或数值。每个日历单元(通常是日)根据其对应的数据值被涂上不同的颜色。这种图表特别适合于展示随时间变化的模式,如温度变化、销售数据、网站流量或任何可以按天聚合的指标。
热力日历图的特点:
-
时间维度展示:按照标准日历的格式,将数据映射到特定的日期上,方便用户理解数据在时间上的分布。用户可以快速识别出数据中的周期性模式、异常值或趋势。
-
颜色编码:通过颜色的深浅来表示数据的量级,直观显示数值的大小。常用的颜色映射包括从蓝色(代表低值)到红色(代表高值)的渐变,或者使用如jet、hot、cool或者自定义颜色等MATLAB预设的颜色映射。
应用场景:
热力日历图可以用在许多不同的领域和场景,包括:
-
地理信息:月天气温度、湿度、降雨量、河流流量等情况
-
个人习惯追踪:如记录运动、睡眠、饮食等日常活动数据。
-
业务分析:比如销售数据的日历视图,展现不同时间段的销售强度。
-
健康监测:追踪患者的体温变化或者其他健康指标。
-
网站分析:显示网站每日访问量,突出高流量日期。
-
项目管理:标记项目的里程碑和截止日期,追踪项目进度。
绘图工具箱
classdef HeatmapCalendar
    %--------------------------------------------------------------------------
    % @Author: 好玩的Matlab
    % @公众号:好玩的Matlab
    % @Created: 11,02,2023
    % @Email: 2377389590@qq.com
    % 尊重劳动成果,转载请备注推文链接和公众号名,严禁商用。
    %--------------------------------------------------------------------------
    properties
        Data
        Year
        Month
        Colormap=hsv(255);
        CMapNum=255;
    end
    methods
        function obj = HeatmapCalendar(varargin)
            disp(char([20844 20247 21495 58 22909 29609 30340 77 97 116 108 97 98]))
            if nargin > 0
                for i = 1:2:nargin
                    if strcmpi(varargin{i}, 'Data')
                        obj.Data = varargin{i+1};
                    elseif strcmpi(varargin{i}, 'Year')
                        obj.Year = varargin{i+1};
                    elseif strcmpi(varargin{i}, 'Month')
                        obj.Month = varargin{i+1};
                    elseif strcmpi(varargin{i}, 'Colormap')
                        obj.Colormap = varargin{i+1};
                    elseif strcmpi(varargin{i}, 'CMapNum')
                        obj.CMapNum = varargin{i+1};
                    end
                end
            end
            if length(obj.Data)~=eomday(obj.Year,obj.Month)
                error('数据和当月时间数据不一致')
            end
            obj.plot();
        end
        function plot(obj)
            dayNames = {'Sun', 'Mon', 'Tue', 'Wed', 'Thu', 'Fri', 'Sat'};
            monthNames = {'January', 'February', 'March', 'April', 'May', 'June', ...
                'July', 'August', 'September', 'October', 'November', 'December'};
            firstDay = weekday(datenum(obj.Year, obj.Month, 1));
            daysInMonth = eomday(obj.Year,obj.Month);
            hold on;
            numWeeks = ceil((firstDay - 1 + daysInMonth) / 7)+1;
            title([monthNames{obj.Month},' ',num2str(obj.Year)], ...
                'HorizontalAlignment', 'center', 'FontSize', 16, 'FontWeight', 'bold','fontname','Times New Roman');
            for i = 1:length(dayNames)
                text((i-0.5)/7, 1-0.5/numWeeks, dayNames{i}, ...
                    'HorizontalAlignment', 'center', 'FontSize', 12, 'FontWeight', 'bold','fontname','Times New Roman');
            end
            normalizedData = (obj.Data - min(obj.Data)) / (max(obj.Data) - min(obj.Data));
            cmap = colormap(obj.makeColorMap(obj.Colormap,obj.CMapNum));
            obj.Colormap=cmap;
            dayCounter = 1;
            for i = 2:numWeeks+1
                for j = 1:7
                    left = (j-1)/7;
                    bottom = 1 - i/numWeeks;
                    width = 1/7;
                    height = 1/numWeeks;
                    if dayCounter > daysInMonth
                        rectangle('Position', [left, bottom, width, height], 'EdgeColor', 'none', 'FaceColor', 'none');
                    elseif i > 1 && j >= firstDay || i > 2
                        colorIdx = max(1, ceil(normalizedData(dayCounter) * size(cmap, 1)));
                        cellColor = cmap(colorIdx, :);
                        rectangle('Position', [left, bottom, width, height], 'EdgeColor',[1,1,1]*0.95, 'FaceColor', cellColor,'LineWidth',2);
                        text(left + width/2, bottom + height/2, num2str(dayCounter),'Color',1-cellColor, ...
                            'HorizontalAlignment', 'center', 'FontSize', 14,'FontName','Times New Roman');
                        dayCounter = dayCounter + 1;
                    else
                        rectangle('Position', [left, bottom, width, height], 'EdgeColor', 'none', 'FaceColor', 'none');
                    end
                end
            end
            cBar=colorbar;
            colormap(cBar,obj.Colormap);
            caxis([min(obj.Data) max(obj.Data)]);
            cBar.LineWidth = 1.2;
            cBar.TickLength = 0.015;
            cBar.TickDirection = 'both';
            cBar.FontSize=12;
            cBar.FontName='Times New Roman';
            axis([0 1 0 1]);
            axis off;
            pbaspect([1 1 1]);
            hold off;
        end
    end
    methods(Access=private)
        function cMap=makeColorMap(obj,colorlist,num)
            color.Num= num;
            color.list=colorlist;
            for col=1:size(color.list,2)
                x=1:size(color.list,1);
                xi=linspace(1,size(color.list,1),color.Num);
                color.map(:,col)=interp1(x,color.list(:,col),xi);
            end
            cMap=color.map;
        end
    end
end
这个 HeatmapCalendar 类是一个 MATLAB 类,用于根据提供的数据绘制一个带有颜色映射的日历。下面是一个逐段的解释:
属性 (Properties)
-
Data:包含用于绘制日历的数据。
-
Year:年份,用于计算日期和确定日历布局。
-
Month:月份,用于计算日期和确定日历布局。
-
Colormap:一个颜色映射,用于根据 Data 的值给日历的每一天上色。默认为 hsv(255),这是MATLAB中的一个预设颜色映射。
-
CMapNum
:颜色映射中的颜色数量,默认为255。
构造函数 (Constructor)
-
HeatmapCalendar(varargin):这个构造函数接受键值对参数,允许用户在创建类的实例时设置属性。如果提供了参数,它将设置相应的属性,并在完成后立即调用 plot 方法来绘制日历。
公共方法 (Methods)
-
plot:这是一个用于绘制日历的方法。它使用 Data, Year, Month 和 Colormap 属性。方法执行以下步骤:
-
计算月份的第一天和天数。
-
计算需要的周数(日历的行数)。
-
在日历上绘制天数和对应的颜色。
-
根据 Data 值的范围,使用颜色映射对每天的格子进行上色。
-
绘制色标 (colorbar),设置色标的属性,如线宽、刻度长度、方向和字体。
-
私有方法 (Private Methods)
-
makeColorMap:这是一个辅助方法,用于从一个给定的颜色列表创建一个颜色映射。这个方法通过插值来生成指定数量的颜色,以便用于日历的颜色编码。
使用方法
默认方法
year=2023;
month=11;
data=rand(eomday(year,month),1)*100;
P=HeatmapCalendar('Data',data,'Year',year,'Month',month);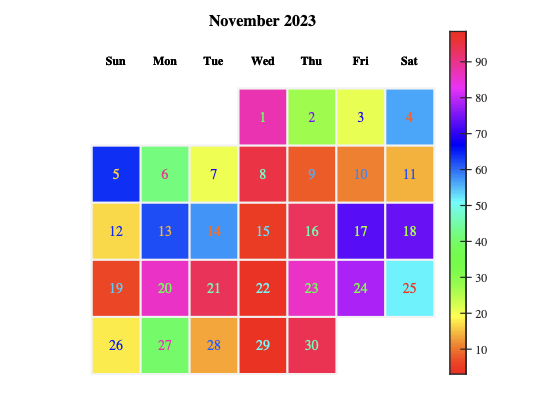
设置颜色数据量
year=2023;
month=11;
data=rand(eomday(year,month),1)*100;
P=HeatmapCalendar('Data',data,'Year',year,'Month',month);
P.CMapNum=4;
P.plot();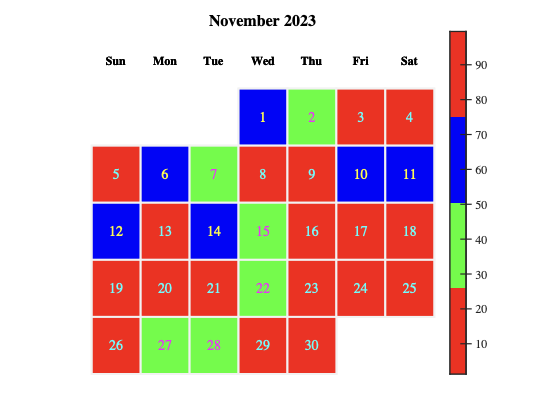
设置不同的颜色条类型
year=2023;
month=11;
data=rand(eomday(year,month),1)*100;
P=HeatmapCalendar('Data',data,'Year',year,'Month',month);
P.Colormap=winter;
P.plot();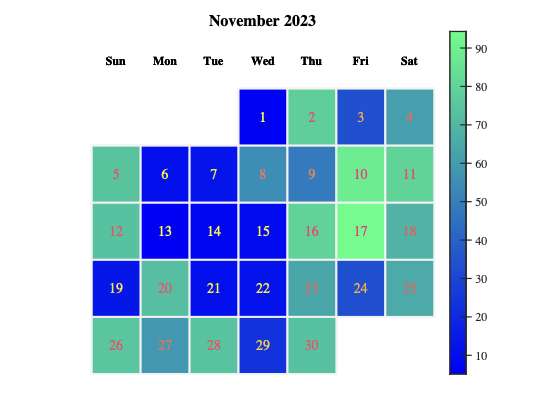
自定义颜色条
year=2023;
month=11;
data=rand(eomday(year,month),1)*100;
P=HeatmapCalendar('Data',data,'Year',year,'Month',month);
P.Colormap=winter;
P.Colormap=[0.0078, 0.0941, 0.7333; 0.9725, 0.0039, 0.5216];
P.plot();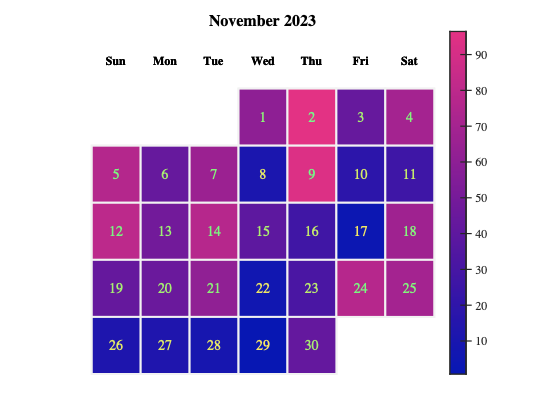
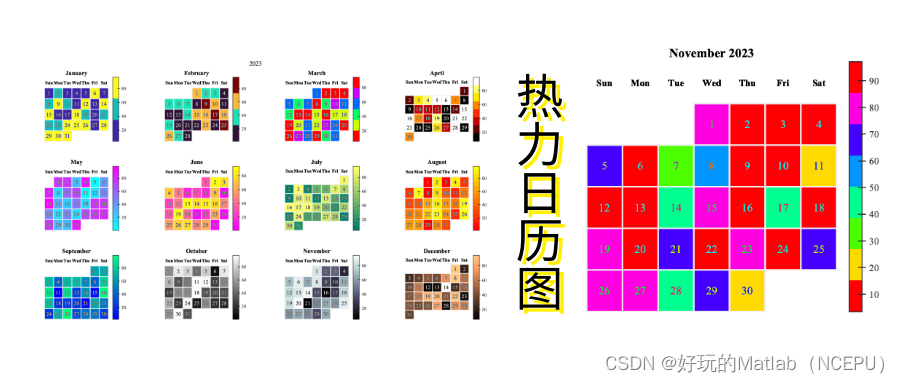
全年每月设置相同的颜色条类型
clc; close all; clear;
figure('Position',[1 72 1512 794])
year=2023;
colormapList={parula,turbo,hsv,hot,cool,spring,summer,autumn,winter,gray,bone,copper,pink,jet};
for month = 1:12
    subplot(3,4,month)
    data=rand(eomday(year,month),1)*100;
    P=HeatmapCalendar('Data',data,'Year',year,'Month',month);
    P.Colormap=hsv;
    P.CMapNum=8;
    P.plot();
    clear data
end
sgtitle(num2str(year),'fontName','Times New Roman','FontSize',16)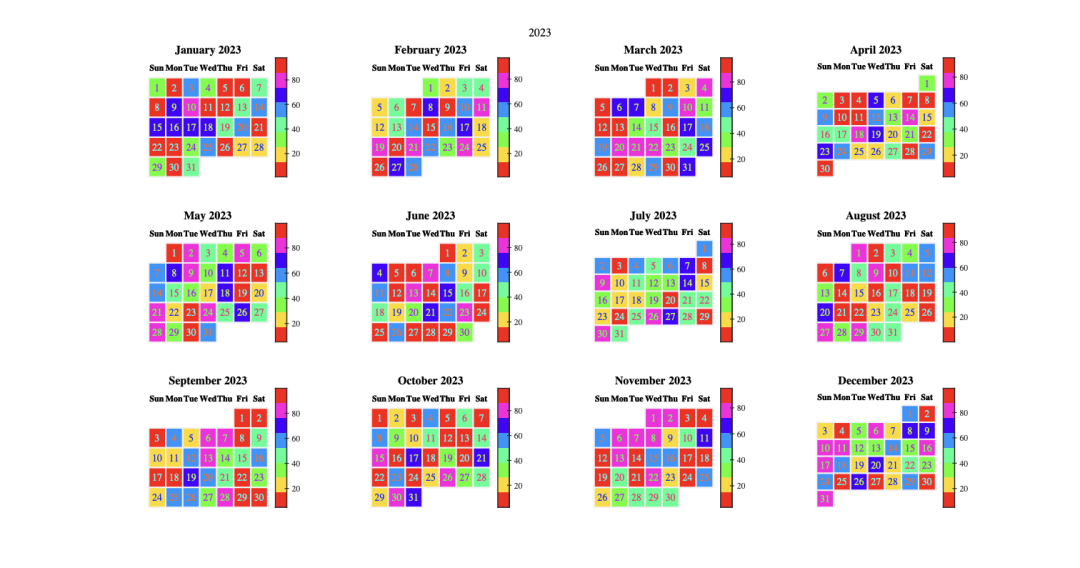
全年每月设置不同的颜色条类型
clc; close all; clear;
figure('Position',[1 72 1512 794])
year=2023;
cMapNum=[3,4,6,8,16,16,16,16,255,255,255,255];
colormapList={parula,turbo,hsv,hot,cool,spring,summer,autumn,winter,gray,bone,copper,pink,jet};
for month = 1:12
    subplot(3,4,month)
    data=rand(eomday(year,month),1)*100;
    P=HeatmapCalendar('Data',data,'Year',year,'Month',month);
    P.Colormap=colormapList{month};
    P.CMapNum=cMapNum(month);
    P.plot();
    clear data
end
sgtitle(num2str(year),'fontName','Times New Roman','FontSize',16)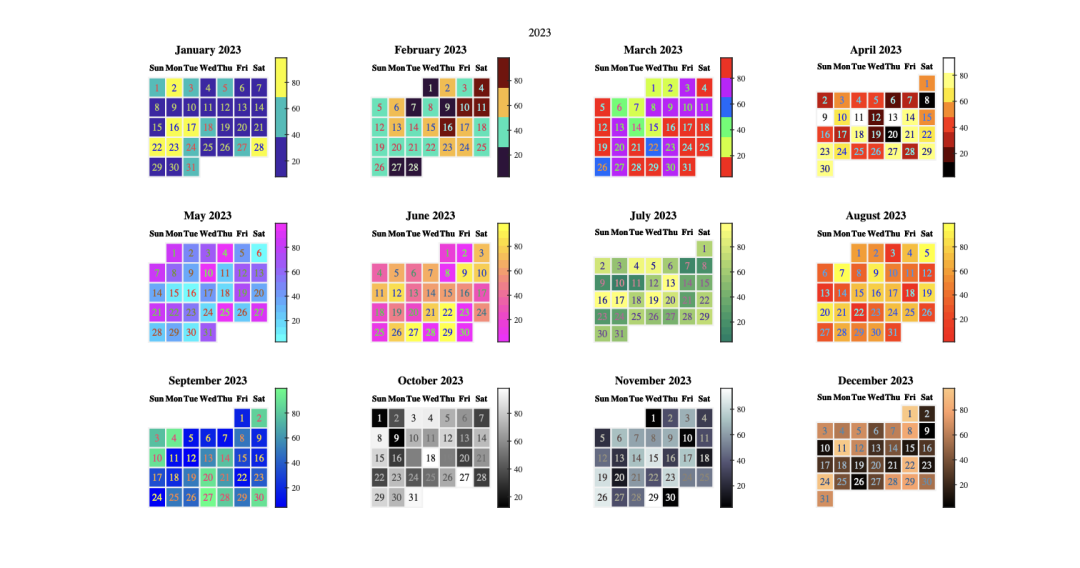

 浙公网安备 33010602011771号