

用Kibana和logstash快速搭建实时日志查询、收集与分析系统(转)
Logstash是一个完全开源的工具,他可以对你的日志进行收集、分析,并将其存储供以后使用(如,搜索),您可以使用它。说到搜索,logstash带有一个web界面,搜索和展示所有日志。
kibana 也是一个开源和免费的工具,他可以帮助您汇总、分析和搜索重要数据日志并提供友好的web界面。他可以为 Logstash 和 ElasticSearch 提供的日志分析的 Web 界面
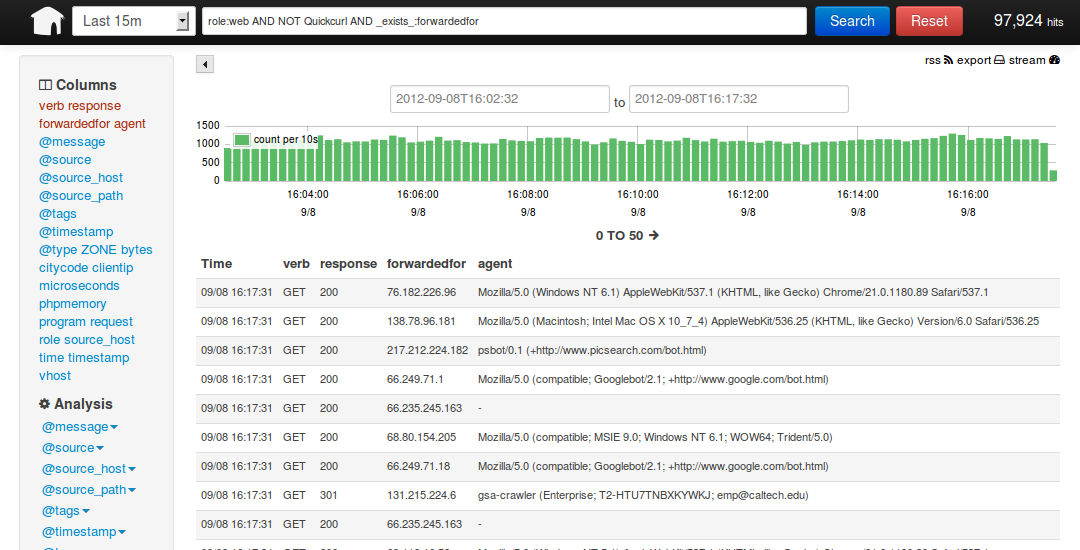
说到这里,我们看看 kibana 和 logstash到底能为我们做些什么呢?下面是kibana的界面
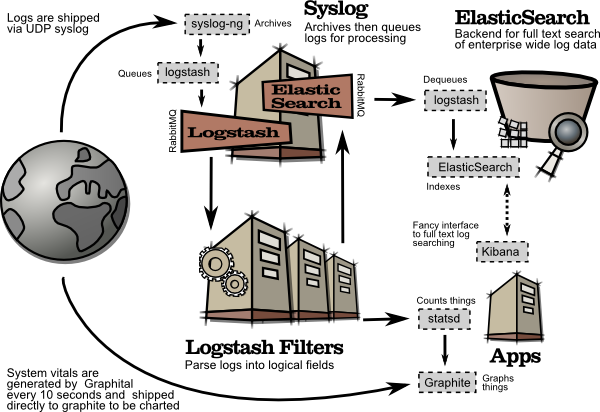
简单来讲他具体的工作流程就是 logstash agent 监控并过滤日志,将过滤后的日志内容发给redis(这里的redis只处理队列不做存储),logstash index将日志收集在一起交给
全文搜索服务ElasticSearch 可以用ElasticSearch进行自定义搜索 通过Kibana 来结合 自定义搜索进行页面展示,下图是 Kibana官网上的流程图
好了 让我们一步步的把这套环境搭建起来吧,先看看都需要安装什么软件包
ruby 运行Kibana 必须,
rubygems 安装ruby扩展必须
bundler 功能类似于yum
JDK 运行java程序必须
redis 用来处理日志队列
logstash 收集、过滤日志
ElasticSearch 全文搜索服务(logstash集成了一个)
kibana 页面展示
这里有三台服务器
192.168.233.128 logstash index,ElasticSearch,kibana,JDK
192.168.233.129 logstash agent,JDK
192.168.233.130 redis
首先到 logstash index服务器上面,logstash分为 index和aget ,agent负责监控、过滤日志,index负责收集日志并将日志交给ElasticSearch 做搜索
此外 logstash 的收集方式分为 standalone 和 centralized。
standalone 是所有功能都在一个服务器上面,自发自收,centralized 就是集中收集,一台服务器接收所有shipper(个人理解就是logstash agent)的日志。
其实 logstash本身不分 什么 shipper 和 collector ,只不过就是配置文件不同而已,我们这次按照集中的方式来测试
在 logstash index上安装基础的软件环境
- [192.168.233.128 root@nodec:~]
- # cd /soft/
- [192.168.233.128 root@nodec:/soft]
- # wget http://down1.chinaunix.net/distfiles/jdk-6u13-dlj-linux-i586.bin
- 从oracle下载实在是太慢了,从CU下载会快一些,如果需要最新版本请访问这里
- http://www.oracle.com/technetwork/java/javase/downloads/jdk7-downloads-1880260.html
- [192.168.233.128 root@nodec:/soft]
- # sh jdk-6u13-dlj-linux-i586.bin
- 输入yes 便开始安装了
- 安装完成后设置一下 JAVA_HOME
- [192.168.233.128 root@nodec:/soft/Kibana-0.2.0]
- # vim /etc/profile
- export JAVA_HOME=/usr/java
- export PATH=$JAVA_HOME/bin:$PATH
- export CLASSPATH=.:$JAVA_HOME/lib/tools.jar:$JAVA_HOME/lib/dt.jar:$CLASSPATH
- 安装ruby 就比较简单了(Kibana需要ruby 1.8.7以上版本)
- [192.168.233.128 root@nodec:/soft]
- # yum install ruby rubygems
- ..... 安装内容省略
- 安装完成后用 rubygems 来安装bundler
- [192.168.233.128 root@nodec:/soft]
- # /usr/bin/gem install bundler
- .....
- ok 这样基本的环境就已经有了,下面就是安装kibana 和 logstash
- 其实logstash 就是一个java脚本,不需要安装... 下载即用
- [192.168.233.128 root@nodec:/soft]
- # wget http://logstash.objects.dreamhost.com/release/logstash-1.1.0-monolithic.jar
- 现在看看 这个脚本应该怎么去执行
- [192.168.233.128 root@nodec:/soft]
- # java -jar /soft/logstash-1.1.0-monolithic.jar -h
- No such command "-h"
- Available commands:
- -v
- -V
- --version
- agent
- web
- test
- 显然没有 -h 参数,不过列出了能用的参数,但是logstash的参数可不止这些,
- java -jar /soft/logstash-1.1.0-monolithic.jar agent --help
- 这些是在agent模式下的命令参数
- -f, --config CONFIGFILE
- Load the logstash config from a specific file, directory, or a wildcard. If given a directory or wildcard, config files will be read in order lexigraphically.
- -e CONFIGSTRING
- Use the given string as the configuration data. Same syntax as the config file. If not input is specified, 'stdin { type => stdin }' is default. If no output is specified, 'stdout { debug => true }}' is default.
- -w, --filterworks COUNT
- Run COUNT filter workers (default: 1)
- --watchdog-timeout TIMEOUT
- Set watchdog timeout value.
- -l, --log FILE
- Log to a given path. Default is to log to stdout
- -v
- Increase verbosity. There are multiple levels of verbosity available with '-vv' currently being the highest
- --pluginpath PLUGIN_PATH
- A colon-delimted path to find other logstash plugins in
- java -jar /soft/logstash-1.1.0-monolithic.jar web --help
- 下面的是在web界面的参数
- --log FILE
- Log to a given path. Default is stdout.
- --address ADDRESS
- Address on which to start webserver. Default is 0.0.0.0.
- --port PORT
- Port on which to start webserver. Default is 9292.
- -B, --elasticsearch-bind-host ADDRESS
- Address on which to bind elastic search node.
- -b, --backend URL
- The backend URL to use. Default is elasticsearch:/// (assumes multicast discovery). You can specify elasticsearch://[host][:port]/[clustername]
如果上面的这些命令都能执行正常的话就表示 logstash可以使用了,但要让他启动还需要一个配置文件
- [192.168.233.128 root@nodec:/soft]
- # vim redis.conf
- input {
- redis {
- host => '192.168.233.130'
- data_type => 'list'
- port => "6379"
- key => 'logstash:redis'
- type => 'redis-input'
- }
- }
- output {
- elasticsearch {
- embedded => true
- }
- }
解释一下 logstash的配置文件由 input filter output 等几个基本的部分组成,顾名思义 input 就是在那收集数据,output就是输出到哪,filter代表一个过滤规则意思是什么内容
会被收集。
上面这段是让 logstash 去192.168.233.130 这个redis服务器上去收集日志 redis端口为6379,key是 logstash:redis 类型为 redis-input ,(注意:这几个值必须跟logstash agent的
output 所对应),收集完成后输出到 elasticsearch ,embedded => true 的意思是使用logstash 内嵌的 elasticsearch。如果有独立的elasticsearch服务器,需要将 这条改为
host => 'elasticsearch的ip' port => 端口
好了,这个简单的配置文件可以让logstash开始启动了
- [192.168.233.128 root@nodec:/soft]
- # java -jar /soft/logstash-1.1.0-monolithic.jar agent -f /soft/redis.conf -- web --backend elasticsearch:///?local &
- [1] 5205
- ...这里要等待约5秒钟... 为什么?去问开发者吧
- [192.168.233.128 root@nodec:/soft]
- # I, [2013-03-19T03:23:10.749000 #5205] INFO -- : Using beta plugin 'redis'. For more information about plugin statuses, see http://logstash.net/docs/1.1.0/plugin-status {"timestamp":"2013-03-19T03:23:10.732000 -0700","message":"Using beta plugin 'redis'. For more information about plugin statuses, see http://logstash.net/docs/1.1.0/plugin-status ","level":"info"}
- file:/soft/logstash-1.1.0-monolithic.jar!/gems/rack-1.3.4/lib/rack/backports/uri/common_192.rb:53 warning: already initialized constant WFKV_
- Mizuno 0.5.0 (Jetty 8.0.y.z-SNAPSHOT) listening on 0.0.0.0:9292
- 解释一下 上面的命令 agent 代理模式 -f 指定配置文件 --web 其实是个分隔符等于又启动了一个命令,后面的参数就是开启一个web页面默认端口是9292,这个命令如果拆成两个就是这个样子
- java -jar /soft/logstash-1.1.0-monolithic.jar agent -f /soft/redis.conf &
- java -jar /soft/logstash-1.1.0-monolithic.jar web --backend elasticsearch:///?local & (其实如果用kibana来做web界面的话这一步完全可以省掉了)
好了,看到9292 端口启动就代表 启动成功了,检查一下
- [192.168.233.128 root@nodec:/soft]
- # lsof -i:9292
- COMMAND PID USER FD TYPE DEVICE SIZE NODE NAME
- java 5205 root 465u IPv4 130805 TCP *:armtechdaemon (LISTEN)
- 其实logstash还启动了一个端口9200,因为启动了内嵌的 elasticsearch,这个9200是 elasticsearch在监听
- [192.168.233.128 root@nodec:/soft]
- # lsof -i:9200
- COMMAND PID USER FD TYPE DEVICE SIZE NODE NAME
- java 5205 root 160u IPv4 130682 TCP *:wap-wsp (LISTEN)
现在可以通过浏览器访问一下 http://192.168.233.128:9292 看看logstash是的页面是个什么样子
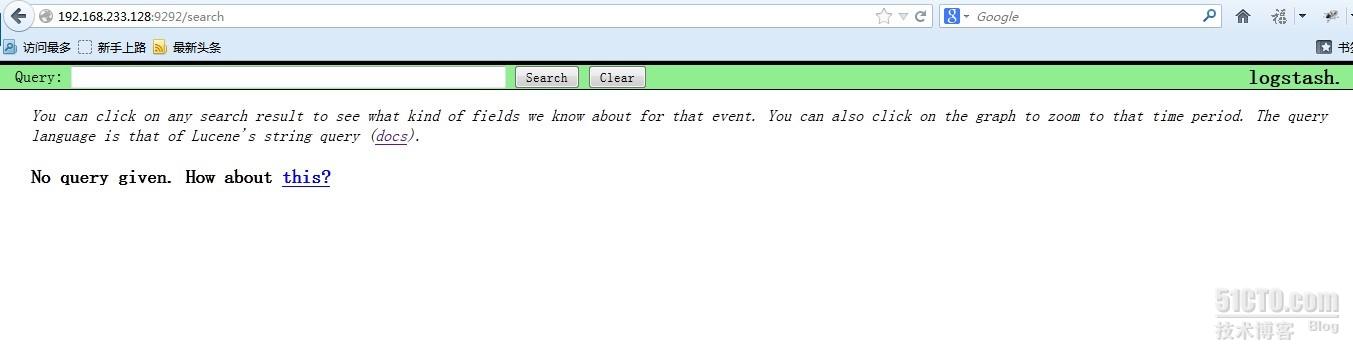 现在还不能搜索因为现在还没有数据,其实这个时候 http://192.168.233.128:9200 也是可以访问的,
很多开发自己写代码来调用elasticsearch 来实现他们自己的需要,这里就不多说了
192.168.233.128 这台logstash index的操作暂时告一段落,下面开始配置logstash的agent
登录到 服务器 192.168.233.129 安装基本软件包和logstash
- [192.168.233.129 root@noded:~]
- # cd /soft/
- [192.168.233.129 root@noded:/soft]
- # wget http://down1.chinaunix.net/distfiles/jdk-6u13-dlj-linux-i586.bin
- [192.168.233.129 root@noded:/soft]
- # sh jdk-6u13-dlj-linux-i586.bin
- 设置 JAVA_HOME
- [192.168.233.129 root@noded:/soft]
- # vim /etc/profile
- export JAVA_HOME=/usr/java
- export PATH=$JAVA_HOME/bin:$PATH
- export CLASSPATH=.:$JAVA_HOME/lib/tools.jar:$JAVA_HOME/lib/dt.jar:$CLASSPATH
- [192.168.233.129 root@noded:/soft]
- # yum install ruby
- 192.168.233.129 root@noded:/soft]
- # wget http://logstash.objects.dreamhost.com/release/logstash-1.1.0-monolithic.jar
- [192.168.233.129 root@noded:/soft]
- # vim redis.conf
- input {
- file {
- type => "producer"
- path => "/soft/apache.log"
- }
- file {
- type => "php-log"
- path => "/soft/php.log"
- }
- }
- filter {
- grep {
- match => [ "@message", "mysql|GET|error" ]
- }
- }
- output {
- redis {
- host => '192.168.233.130'
- data_type => 'list'
- key => 'logstash:redis'
- }
- }
大概说一下这个配置文件 input 里的file就是要监视的文件了 这里我监视了两个文件,如果这两个文件有追加的内容就会通过下面的output设置发给 redis服务器
filter 里的grep 意思就是 grep... 后面这段就是 日志内容里面只要有匹配 mysql或GET或error的内容就会被过滤出来,发送到 logstash index
以上就是一个比较简单的配置文件了,让我们启动他
- [192.168.233.129 root@noded:/soft]
- # java -jar /soft/logstash-1.1.0-monolithic.jar agent -f /soft/redis.conf &
- I, [2013-03-19T19:45:35.762000 #2721] INFO -- : Using beta plugin 'file'. For more information about plugin statuses, see http://logstash.net/docs/1.1.0/plugin-status {"timestamp":"2013-03-19T19:45:35.752000 -0700","message":"Using beta plugin 'file'. For more information about plugin statuses, see http://logstash.net/docs/1.1.0/plugin-status ","level":"info"}
- I, [2013-03-19T19:45:35.778000 #2721] INFO -- : Using beta plugin 'file'. For more information about plugin statuses, see http://logstash.net/docs/1.1.0/plugin-status {"timestamp":"2013-03-19T19:45:35.778000 -0700","message":"Using beta plugin 'file'. For more information about plugin statuses, see http://logstash.net/docs/1.1.0/plugin-status ","level":"info"}
- I, [2013-03-19T19:45:35.804000 #2721] INFO -- : Using beta plugin 'grep'. For more information about plugin statuses, see http://logstash.net/docs/1.1.0/plugin-status {"timestamp":"2013-03-19T19:45:35.803000 -0700","message":"Using beta plugin 'grep'. For more information about plugin statuses, see http://logstash.net/docs/1.1.0/plugin-status ","level":"info"}
- I, [2013-03-19T19:45:35.854000 #2721] INFO -- : Using beta plugin 'redis'. For more information about plugin statuses, see http://logstash.net/docs/1.1.0/plugin-status {"timestamp":"2013-03-19T19:45:35.853000 -0700","message":"Using beta plugin 'redis'. For more information about plugin statuses, see http://logstash.net/docs/1.1.0/plugin-status ","level":"info"}
只要没有 warning 和 error就算是正常启动了
启动之前请确定 192.168.233.130的 redis服务器已经启动,不然会报错
下面登录到 192.168.233.130 上看看 redis服务的状态
- [192.168.233.130 root@nodea:/data/redis/etc]
- # lsof -i:6379
- COMMAND PID USER FD TYPE DEVICE SIZE NODE NAME
- redis-ser 2732 root 4u IPv4 7946 TCP *:6379 (LISTEN)
- redis-ser 2732 root 5u IPv4 7963 TCP localhost.localdomain:6379->localhost.localdomain:19214 (ESTABLISHED)
- java 2733 root 9u IPv4 7959 TCP localhost.localdomain:19214->localhost.localdomain:6379 (ESTABLISHED)
- 状态正常,端口处于监听状态,我用的是最简单的 配置,
- [192.168.233.130 root@nodea:/data/redis/etc]
- # vim redis.conf
- #this is the config file for redis
- pidfile /var/run/redis.pid
- port 6379
- timeout 0
- loglevel verbose
- logfile /data/redis/log/redis.log
- dbfilename dump.rdb
- dir /data/redis/db/
- vm-swap-file /tmp/redis.swap
- activerehashing yes
- 启动命令如下
- [192.168.233.130 root@nodea:/data/redis/etc]
- # redis-server /data/redis/etc/redis.conf &
下载安装就比较简单了
- [192.168.233.130 root@nodea:/soft]
- # wget http://redis.googlecode.com/files/redis-2.4.14.tar.gz
- [192.168.233.130 root@nodea:/data/redis/etc]
- # make –j24
- [192.168.233.130 root@nodea:/data/redis/etc]
- # make install
配置文件里的那几个路径要提前建好
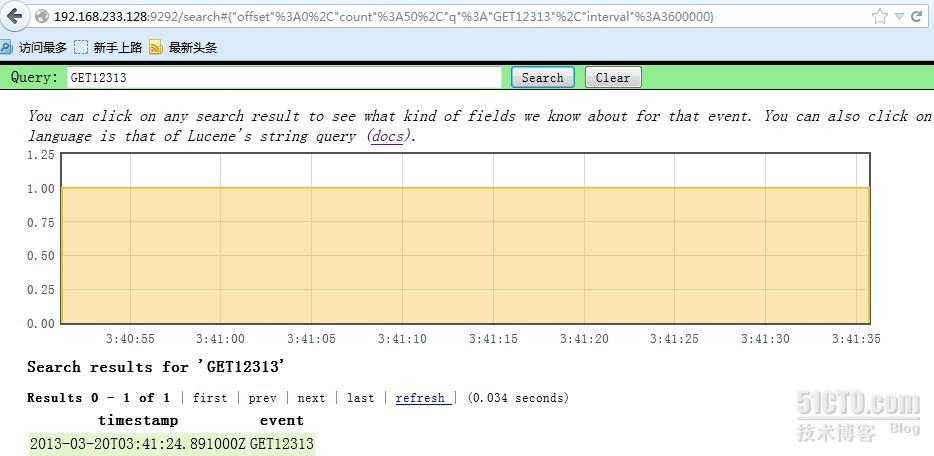
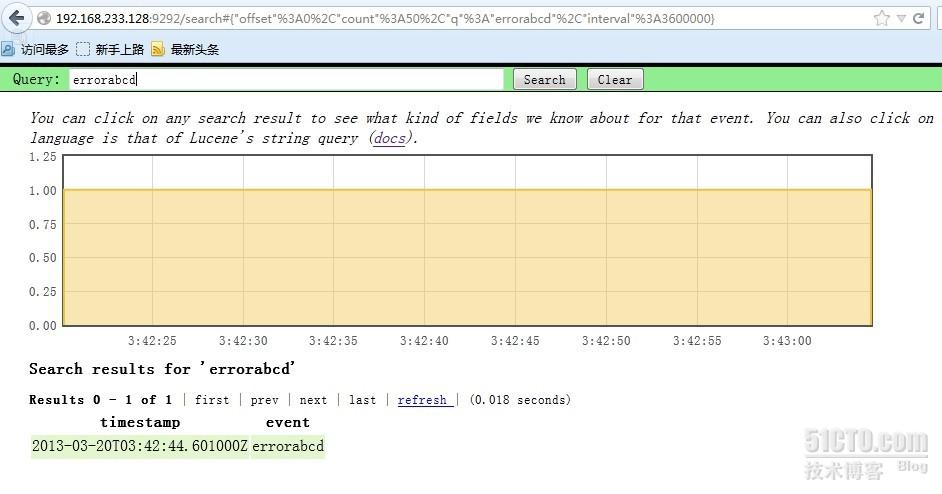
最后我们回到 logstash agent 上面测试一下
- [192.168.233.129 root@noded:/soft]
- # echo GET12313 >> apache.log
- [192.168.233.129 root@noded:/soft]
- # echo errorabcd >> apache.log
ok 到 http://192.168.233.128:9292 去搜索一下 刚才的两个内容
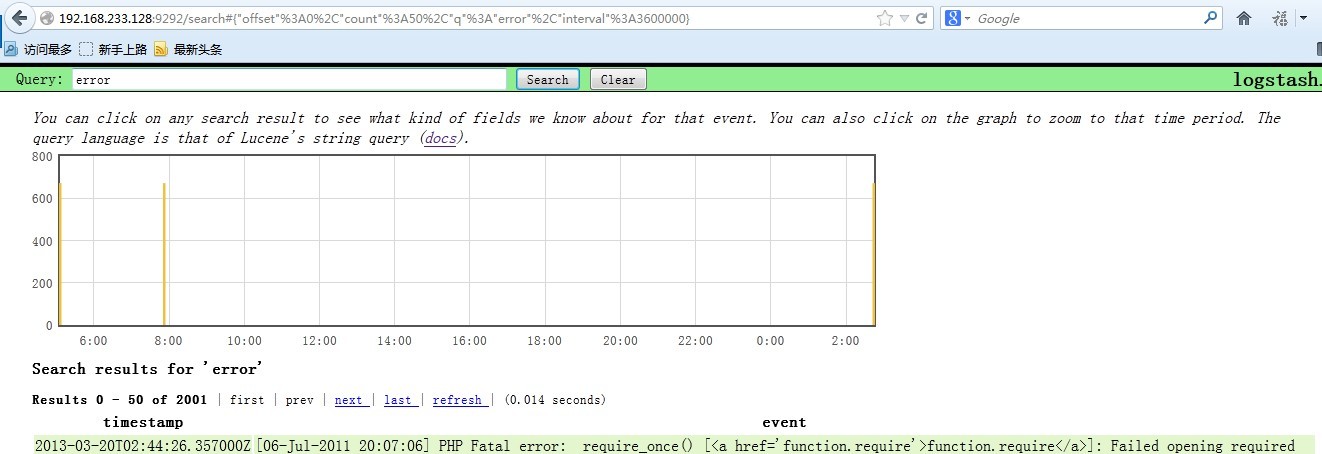
嗯,就是这样了,我现在找个php的错误日志给他追加到php.log文件里
[192.168.233.129 root@noded:/soft]
# cat php-error.log >> php.log
在看看 logstash的页面 搜索一下 error
OK,最后就是 Kibana了 ,我把Kibana装在了 logstash index上面
下载地址为 http://kibana.org/intro.html
- [192.168.233.128 root@nodec:/soft]
- # tar xf Kibana-0.2.0.tar.gz
- [192.168.233.128 root@nodec:/soft]
- # cd Kibana-0.2.0
- [192.168.233.128 root@nodec:/soft/Kibana-0.2.0]
- # bundle install
- 直接安装就好了,非常简单,因为之前咱们已经安装好了 bundle
- 编辑配置文件,指定 elasticsearch 的位置
- [192.168.233.128 root@nodec:/soft/Kibana-0.2.0]
- # vim KibanaConfig.rb
- .....
- Elasticsearch = "localhost:9200"
- KibanaPort = 5601
- KibanaHost = '0.0.0.0'
- .....
- 主要是这几个参数
- 启动的话需要ruby
- [192.168.233.128 root@nodec:/soft/Kibana-0.2.0]
- # /usr/bin/ruby kibana.rb &
- [192.168.233.128 root@nodec:/soft/Kibana-0.2.0]
- # == Sinatra/1.3.5 has taken the stage on 5601 for development with backup from Thin
- >> Thin web server (v1.5.0 codename Knife)
- >> Maximum connections set to 1024
- >> Listening on 0.0.0.0:5601, CTRL+C to stop
- 如果ruby的东西都不缺的话,启动会很顺利,ok 现在看看5601端口的状态
- [192.168.233.128 root@nodec:/soft/Kibana-0.2.0]
- # lsof -i:5601
- COMMAND PID USER FD TYPE DEVICE SIZE NODE NAME
- ruby 3116 root 5u IPv4 28947 TCP *:esmagent (LISTEN)
访问一下 试试看 http://192.168.233.128:5601 尝试搜索一下php的错误日志,比如mysql

呵呵,要的就是这个效果,日志会实时的汇总到 logstash index 上供我们查询,当然这只是开始使用logstash的第一步而已,更多的高级功能可以看看官方文档
http://logstash.net/docs/1.1.9/
如果有问题大家可以一起探讨,我也是刚开始接触这个东东,收集日志是相当方便啊,据说还能跟nagios结合. 呵呵
本文出自 “story的天空” 博客,请务必保留此出处http://storysky.blog.51cto.com/628458/1158707
请问,logstash为什么需要redis?还是没明白。我测试过,如果没有redis,也没问题呀。我搭了两台logstatsh,同时发往 elasticsearch,能够查到两台机器的日志。请问redis到底有什么用呀?队列?没明白。如果没有redis,像我那么搭建环境,有什么问题 吗?
你可以参考这个讨论
https://groups.google.com/forum/?fromgroups#!searchin/logstash-users/redis/logstash-users/VakCOAzZI8k/LKw4OTov3OUJ
按照你得资料从前到后配置,运行后报错:
java -jar /soft/logstash-1.1.0-monolithic.jar agent -f /soft/redis.conf -- web --backend elasticsearch:///?local &
是不是要现配置 192.168.233.130 redis 服务才行啊, 你的逻辑不知道是不是需要我们理顺。
W,
[2013-07-25T17:02:51.762000 #11475] WARN -- : Input thread exception
{"timestamp":"2013-07-25T17:02:51.762000
+0800","plugin":"LogStash::Inputs::Redis:
{\"host\"=>\"211.50.158.87\", \"data_type\"=>\"list\",
\"port\"=>6379, \"key\"=>\"logstash:redis\",
\"type\"=>\"redis-input\", \"debug\"=>false, \"add_field\"=>{},
\"name\"=>\"default\", \"db\"=>0,
\"timeout\"=>5}","exception":"Connection refused - Unable to connect
to Redis on
210.5.158.87:6379","backtrace":["file:/soft/logstash-1.1.0-monolithic.jar!/gems/redis-2.2.2/lib/redis/client.rb:236:in
`establish_connection'","file:/soft/logstash-1.1.0-monolithic.jar!/gems/redis-2.2.2/lib/redis/client.rb:233:in
`establish_connection'","file:/soft/logstash-1.1.0-monolithic.jar!/gems/redis-2.2.2/lib/redis/client.rb:23:in
`connect'","file:/soft/logstash-1.1.0-monolithic.jar!/gems/redis-2.2.2/lib/redis/client.rb:178:in
`without_socket_timeout'","file:/soft/logstash-1.1.0-monolithic.jar!/gems/redis-2.2.2/lib/redis/client.rb:128:in
`call_without_timeout'","file:/soft/logstash-1.1.0-monolithic.jar!/gems/redis-2.2.2/lib/redis.rb:385:in
`blpop'","file:/soft/logstash-1.1.0-monolithic.jar!/META-INF/jruby.home/lib/ruby/1.9/monitor.rb:201:in
`mon_synchronize'","file:/soft/logstash-1.1.0-monolithic.jar!/META-INF/jruby.home/lib/ruby/1.9/monitor.rb:200:in
`mon_synchronize'","file:/soft/logstash-1.1.0-monolithic.jar!/gems/redis-2.2.2/lib/redis.rb:384:in
`blpop'","file:/soft/logstash-1.1.0-monolithic.jar!/logstash/inputs/redis.rb:112:in
`list_listener'","org/jruby/RubyBasicObject.java:1700:in
`__send__'","org/jruby/RubyKernel.java:2122:in
`send'","file:/soft/logstash-1.1.0-monolithic.jar!/logstash/inputs/redis.rb:157:in
`listener_loop'","org/jruby/RubyKernel.java:1420:in
`loop'","file:/soft/logstash-1.1.0-monolithic.jar!/logstash/inputs/redis.rb:154:in
`listener_loop'","file:/soft/logstash-1.1.0-monolithic.jar!/logstash/inputs/redis.rb:169:in
`run'","file:/soft/logstash-1.1.0-monolithic.jar!/logstash/agent.rb:631:in
`run_input'","file:/soft/logstash-1.1.0-monolithic.jar!/logstash/agent.rb:322:in
`start_input'"],"message":"Input thread exception","level":"warn"}
192.168.233.129 logstash agent,JDK
192.168.233.130 redis
楼主,又来打扰你了,能不能把128、129服务放到一起呢,不知道为什么要放到不同服务器。
/usr/lib/ruby/site_ruby/1.8/rubygems/custom_require.rb:31: command not found: git ls-files
sh: git: command not found
Fetching gem metadata from http://rubygems.org/.........
Fetching gem metadata from http://rubygems.org/..
Resolving dependencies...
Using rake (10.0.3)
Using daemons (1.1.9)
Using diff-lcs (1.1.3)
Installing eventmachine (1.0.3)
Gem::Installer::ExtensionBuildError: ERROR: Failed to build gem native extension.
/usr/bin/ruby extconf.rb
checking for rb_trap_immediate in ruby.h,rubysig.h... yes
checking for rb_thread_blocking_region()... no
checking for inotify_init() in sys/inotify.h... yes
checking for writev() in sys/uio.h... yes
checking for rb_wait_for_single_fd()... no
checking for rb_enable_interrupt()... no
checking for rb_time_new()... yes
checking for sys/event.h... no
checking for epoll_create() in sys/epoll.h... yes
creating Makefile
make
g++ -I. -I. -I/usr/lib64/ruby/1.8/x86_64-linux -I. -DWITH_SSL -DBUILD_FOR_RUBY -DHAVE_RB_TRAP_IMMEDIATE -DHAVE_RBTRAP -DHAVE_INOTIFY_INIT -DHAVE_INOTIFY -DHAVE_WRITEV -DHAVE_WRITEV -DHAVE_RB_TIME_NEW -DOS_UNIX -DHAVE_EPOLL_CREATE -DHAVE_EPOLL -fPIC -O2 -g -pipe -Wall -Wp,-D_FORTIFY_SOURCE=2 -fexceptions -fstack-protector --param=ssp-buffer-size=4 -m64 -mtune=generic -fno-strict-aliasing -fPIC -c em.cpp
make: g++: Command not found
make: *** [em.o] Error 127
Gem files will remain installed in /usr/lib/ruby/gems/1.8/gems/eventmachine-1.0.3 for inspection.
Results logged to /usr/lib/ruby/gems/1.8/gems/eventmachine-1.0.3/ext/gem_make.out
An error occurred while installing eventmachine (1.0.3), and Bundler cannot continue.
Make sure that `gem install eventmachine -v '1.0.3'` succeeds before bundling.
软件我放到一个服务器了, 安装kibana 报错, 看了安装kibana的安装条件
Requirements
Base
ruby >= 1.8.7 (probably?) 查过了ruby
]# find / -name ruby
/usr/bin/ruby
/usr/lib64/ruby
/usr/lib/ruby
/usr/lib/ruby/gems/1.8/gems/activesupport-3.2.14/lib/active_support/ruby
/usr/lib/ruby/gems/1.8/gems/activesupport-3.2.14/lib/active_support/testing/performance/ruby
bundler
/usr/lib64/ruby/gems/1.8/doc/bundler-1.3.5/rdoc/files/lib/bundler
/usr/lib64/ruby/gems/1.8/gems/bundler-1.3.5/spec/bundler
/usr/lib64/ruby/gems/1.8/gems/bundler-1.3.5/lib/bundler
/usr/lib/ruby/gems/1.8/doc/bundler-1.3.5/rdoc/files/lib/bundler
/usr/lib/ruby/gems/1.8/gems/bundler-1.3.5/spec/bundler
/usr/lib/ruby/gems/1.8/gems/bundler-1.3.5/lib/bundler
logstash >= 1.1.0
logstash-1.1.0-monolithic.jar
elasticsearch >= 0.18.0
ruby]# find / -name elasticsearch
/root/data/elasticsearch
/opt/tool/elasticsearch
/opt/tool/elasticsearch-0.90.2/data/elasticsearch
/opt/tool/elasticsearch-0.90.2/bin/elasticsearch
/soft/data/elasticsearch
JRuby
java >= 1.6
ruby]# java -version
java version "1.7.0_25"
Java(TM) SE Runtime Environment (build 1.7.0_25-b15)
Java HotSpot(TM) 64-Bit Server VM (build 23.25-b01, mixed mode)
warbler if you want to create an executable standalone war file(这个不知道warbler什么意思)
kibana 软件的要求环境都OK, 我的kibana 安装就报错,说什么gem安装前绑定,什么意思,求 楼主赐教。
make: g++: Command not found
make: *** [em.o] Error 127
{:timestamp=& gt;"2013-10-17T12:34:15.249000+0800", :message=>"Using milestone 2 output plugin 'redis'. This plugin should be stable, but if you see strange behavior, please let us know! For more information on plugin milestones, see http://logstash.net/docs/1.2.1/plugin-milestones", :level=>:warn}
算是能读取到日志信息了吗?
怎么判断logstashAgent成功读取到日志信息的?
NativeException - org.elasticsearch.action.search.SearchPhaseExecutionException: Failed to execute phase [initial], No indices / shards to search on, requested indices are []:
楼主遇到过吗???搞了一天了。
[root@slave kibana-3.0.1]# bundle install
Don't run Bundler as root. Bundler can ask for sudo if it is needed, and installing your bundle as root will break this application for all non-root users on this
machine.
Could not locate Gemfile
没找到答案 你遇到过么
No events matched
Sorry, I couldn't find anything for that query. Double check your spelling and syntax.
不知道啥问题 一切启动正常 9200 9292端口正常 求帮忙谢谢
E, [2014-07-02T02:43:42.671000 #11095] ERROR -- : Config validation failed. {"timestamp":"2014-07-02T02:43:42.670000 +0800","message":"Config validation failed.","level":"error"}
Exception in thread "LogStash::Agent" org.jruby.exceptions.RaiseException: (SystemExit) exit
这个是因为什么?
input {
redis {
host =>'192.168.11.136'
date_type =>'list'
port =>"6379"
key =>'logstash:redis'
type =>'redis-input'
}
}
output {
elasticsearch {
embedded =>true
}
}
~
~
~
那个字段写错了,现在搭建好了,可是不太明白它是如何去监控交换机日志的,另外我在交换机上配置好了,这个交换机日志发送到服务器上的哪个目录下了?如何和上面的日志服务器关联起来进行日志的监控?能不能加下您的QQ说下。我的Q:904567481
我最近也在研究这个,报错不知道怎么解决 你能加下我么 373858056
input {
file {
type => "err_message"
path => "/var/log/messages"
}
file {
type => "err_secure"
path => "/var/log/secure"
}
}
output {
redis {
host => "10.1.1.134"
data_type => "list"
key => "logstash:redis"
}
}
在path一栏,文件名是固定的,但是现在每天都会生成一个新日志类似 test-2014-07-31.log,然后明天 又一个test-2014-08-01.log这样的递增,求教怎样定义pash这一项的路径啊?感恩跪谢!在线等!!!
Don't run Bundler as root. Bundler can ask for sudo if it is needed, and installing your bundle as root will break this application
for all non-root users on this machine.
Fetching gem metadata from http://rubygems.org/.........
Resolving dependencies...
Using rake 10.0.3
Using daemons 1.1.9
Using diff-lcs 1.1.3
Gem::Installer::ExtensionBuildError: ERROR: Failed to build gem native extension.
/usr/bin/ruby extconf.rb
mkmf.rb can't find header files for ruby at /usr/lib/ruby/ruby.h
Gem files will remain installed in /usr/lib/ruby/gems/1.8/gems/eventmachine-1.0.3 for inspection.
Results logged to /usr/lib/ruby/gems/1.8/gems/eventmachine-1.0.3/ext/gem_make.out
An error occurred while installing eventmachine (1.0.3), and Bundler cannot continue.
Make sure that `gem install eventmachine -v '1.0.3'` succeeds before bundling.
[root@localhost Kibana]# gem install eventmachine -v '1.0.3'
Building native extensions. This could take a while...
ERROR: Error installing eventmachine:
ERROR: Failed to build gem native extension.
/usr/bin/ruby extconf.rb
mkmf.rb can't find header files for ruby at /usr/lib/ruby/ruby.h
Gem files will remain installed in /usr/lib/ruby/gems/1.8/gems/eventmachine-1.0.3 for inspection.
Results logged to /usr/lib/ruby/gems/1.8/gems/eventmachine-1.0.3/ext/gem_make.out
[root@localhost Kibana]# /usr/bin/ruby extconf.rb
/usr/bin/ruby: No such file or directory -- extconf.rb (LoadError)
安装kibana时候报这个错误。。实在是解决不了前来求助。。前几步没有任何问题
第一次在51cto上留言,按照你的方法搭建,遇到如下问题,百思不得其解,也尝试了很多别的方法,都失败了。还想请教下您,如果方便,可否加我QQ:215248943,详细讨论
问题如下:
在 运行java -jar /data/logstash/logstash-1.1.0-monolithic.jar web --backend elasticsearch:///?local &后,出现报错: file:/data/logstash/logstash-1.1.0-monolithic.jar!/gems/rack-1.3.4/lib/rack/backports/uri/common_192.rb:53 warning: already initialized constant WFKV_
log4j:WARN No appenders could be found for logger (org.elasticsearch.node).
log4j:WARN Please initialize the log4j system properly.
log4j:WARN See http://logging.apache.org/log4j/1.2/faq.html#noconfig for more info.
Mizuno 0.5.0 (Jetty 8.0.y.z-SNAPSHOT) listening on 0.0.0.0:9292
logstah可以通过9292打开,都是搜索功能不能使用
盼复!!
博主的那个kibana版本已经无法下载了,我使用kibiana-3.0 version页面倒是访问到了,但是搜索不到日志。说明还是不能直接使用,需要开启相应的端口。现在还没解决这个问题。
安装报错
[root@localhost kibana-4.1.1-linux-x64]# bundle install
Don't run Bundler as root. Bundler can ask for sudo if it is needed, and installing your bundle as root will break this application
for all non-root users on this machine.
Could not locate Gemfile or .bundle/ directory

 浙公网安备 33010602011771号
如果你想完全按照我的配置来做,那你必须配置redis