graphviz.js划线操作
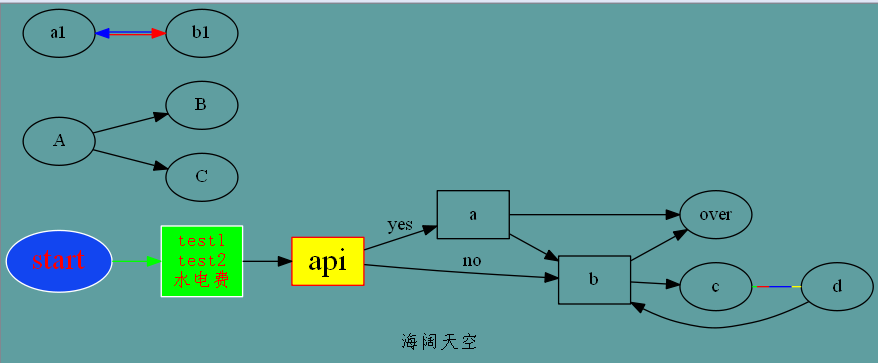
digraph A{
    graph[color=red bgcolor="cadetblue" label="海阔天空",fontname="FangSong"]
    start[color=white,fontcolor=red,fontsize=23,style=filled,fillcolor="#1245f0"];
ini[fontname="FangSong",label="test1\ntest2\n水电费",color=white,fontcolor=red,style=filled,fillcolor=green,shape=box]
api[color=red,fontcolor=black,fontsize=24,style=filled,fillcolor=yellow,shape=voal]
over;
    a[shape=box];b[shape=box]

    rankdir=LR;//表示从左到右显示
    a->b->c;
    d->b[constraint=false]//代表此为辅
    start->ini[color=green]
    ini->api
    api->a[label="yes"]
    api->b[label="no"]
    a->over;
    b->over;
    A->{B C}
    rank=same;A;B;C;

    a1->b1[dir=both color="red:blue"]
    c->d[dir=none color="green;0.1:red;0.25:blue;0.45:yellow"]

}
图: