

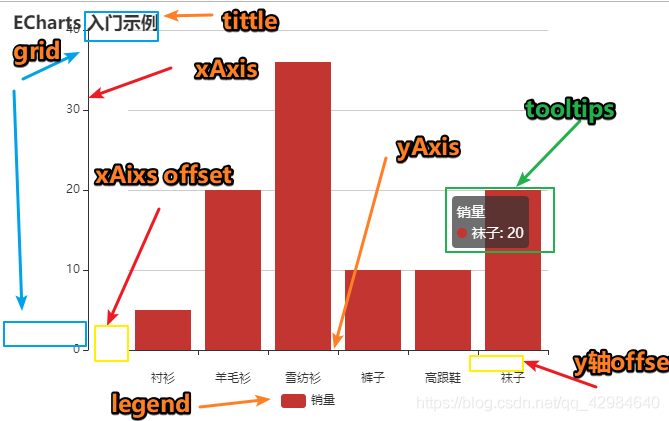
echarts笔记
<template>
<div>
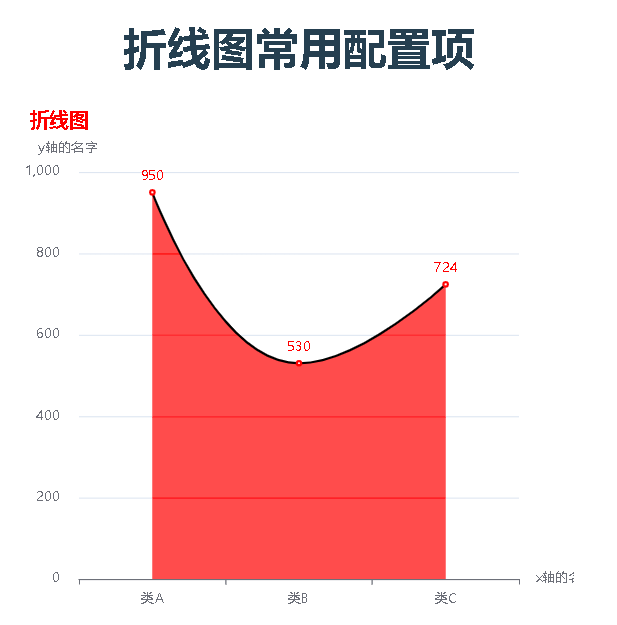
<h1>折线图常用配置项</h1>
<div id="line">折线图</div>
</div>
</template>
<script>
import * as echarts from 'echarts'
export default {
methods: {
drawImg() {
let dom = document.getElementById('line')
let myChart = echarts.init(dom)
let option
option = {
// 标题
title: {
show: true, //是否显示标题组件
text: '折线图', //主标题文本
link: '', //主标题文本超链接
target: 'blank', //指定窗口打开主标题超链接
textStyle: {
fontSize: 18, //字体的大小
color: 'red',
fontStyle: 'normal', //字体的风格
fontWeight: 'bold', //文字字体的粗细
fontFamily: 'sans-serif', //字体系列
},
subtext: '', //副标题文本
sublink: '', //副标题文本超链接
subtarget: 'blank', //指定窗口打开副标题超链接
subtextStyle: {
fontSize: 18, //字体的大小
color: 'red',
fontStyle: 'normal', //字体的风格
fontWeight: 'bold', //文字字体的粗细
fontFamily: 'sans-serif', //字体系列
},
textAlign: 'auto', //整体的水平对齐。
textVerticalAlign: 'auto', //整体的垂直对齐。
},
// 图例组件
legend: {
type: 'plain', //普通图例 sroll//滚动图例
show: 'true', //是否显示图例
left: 'auto', //图例组件离容器左侧的距离。
top: 'auto', //图例组件离容器上侧的距离。
right: 'auto', //图例组件离容器右侧的距离。
bottom: 'auto', //图例组件离容器下侧的距离
width: 'auto', //图例组件的宽度。默认自适应。
height: 'auto', //图例组件的高度。默认自适应。
orient: 'horizontal', //horizontal||vertical
align: 'auto', //left||right图例标记和文本的对齐
itemGap: '10', //图例每项之间的间隔。
itemWidth: '25', //图例标记的图形宽度。
itemHeight: '14', //图例标记的图形高度。
itemStyle: {}, //图例的图形样式
},
// 提示框组件
tooltip: {
show: 'true', //是否显示提示
trigger: 'item', //触发类型。(item||axis)
triggerOn: 'mousemove|click', //提示框触发的条件
position: ['50%', '50%'], //提示框浮层的位置
backgroundColor: 'red', //提示框浮层的背景颜色。
borderColor: 'blue', //提示框浮层的边框颜色。
borderWidth: 10, //提示框浮层的边框宽,
textStyle: {}, //提示框浮层的文本样式,
},
//x轴
xAxis: {
show: true, //是否显示 x 轴。
position: 'bottom', //x 轴的位置(top||bottom)
offset: 5, //默认位置的偏移,
type: 'category', //坐标轴类型(value-数值轴,category-类目轴,time-时间轴,log-对数轴
name: 'x轴的名字',
// min: 0, //坐标轴刻度最小值。
// max: 1000, //坐标轴刻度最大值。
data: ['类A', '类B', '类C'], //类型排序
},
//y轴
yAxis: {
show: true, //是否显示 y 轴。
position: 'left', //y 轴的位置。(left|right)
offset: 10, //Y 轴相对于默认位置的偏移
type: 'value', //坐标轴类型(value-数值轴,category-类目轴,time-时间轴,log-对数轴
name: 'y轴的名字',
min: 0, //坐标轴刻度最小值。
max: 1000, //坐标轴刻度最大值。
},
//工具
toolbox: {
show: true, //是否显示工具栏组件。
orient: 'horizontal', //工具栏 icon 的布局朝向
itemSize: 15, //工具栏 icon 的大小。
itemGap: 8, //工具栏 icon 每项之间的间隔
showTitle: 'true', //是否在鼠标 hover 的时候显示每个工具 icon 的标题。
feature: '', //自定义工具按钮。
iconStyle: {
borderColor: '#666',
}, //公用的 icon 样式设置
left: 'auto', //工具栏组件离容器左侧的距离。
top: 'auto', //工具栏组件离容器上方的距离。
right: 'auto', //工具栏组件离容器右侧的距离。
bottom: 'auto', //工具栏组件离容器下方的距离。
width: 'auto', //工具栏组件的宽度。默认自适应。
height: 'auto', //工具栏组件的高度。默认自适应。
},
//series
series: [
// 折线图
{
// name: '', //系列名称
type: 'line',
//标志图形的设置
colorBy: 'series', //series点的颜色都是一样的,data点的颜色按照类型显示
symbol: 'emptyCircle', //折线连接点的形状
symbolSize: 4, //折线标志图形的大小
symbolOffset: [0, 0], //折线标志图形的偏移量
showSymbol: 'true', //是否显示 标志图形
legendHoverLink: 'true', //是否启用标志图形 hover 时的联动高亮。
// 标签的设置
label: {
show: true, //是否显示标签。
position: 'top', //标签的位置。
color: 'red', //文字的颜色。
fontSize: 12, //文字的字体大小。
},
// 折线拐点标志的样式
itemStyle: {
color: 'red',
},
// 线条样式。
lineStyle: {
color: '#000',
},
// 区域填充样式
areaStyle: {},
// 折线图的高亮状态。
emphasis: {},
smooth: true, //是否平滑曲线显示。
data: [950, 530, 724],
},
],
}
myChart.setOption(option)
},
},
mounted() {
this.drawImg()
},
}
</script>
<style lang="less" scoped>
#line {
width: 500px;
height: 500px;
margin: 0 auto;
}
</style>


【推荐】国内首个AI IDE,深度理解中文开发场景,立即下载体验Trae
【推荐】编程新体验,更懂你的AI,立即体验豆包MarsCode编程助手
【推荐】抖音旗下AI助手豆包,你的智能百科全书,全免费不限次数
【推荐】轻量又高性能的 SSH 工具 IShell:AI 加持,快人一步
· 分享一个免费、快速、无限量使用的满血 DeepSeek R1 模型,支持深度思考和联网搜索!
· 基于 Docker 搭建 FRP 内网穿透开源项目(很简单哒)
· ollama系列01:轻松3步本地部署deepseek,普通电脑可用
· 25岁的心里话
· 按钮权限的设计及实现