owchart证券图形控件学习:如何添加画线?
源码:


public Form1()
        {
            InitializeComponent();

            Chart chart = new Chart();  //创建K线
            chart.Dock = DockStyle.Fill;  //设置填充
            Controls.Add(chart);   //添加控件

            //设置显示左轴的宽度
            chart.LeftYScaleWidth = 100;
            //设置K线的间隔
            chart.XScalePixel = 20;

            //添加第一个层,占100%
            ChartDiv div1 = chart.AddChartDiv(70);
            //开盘价=0,最高价=1,最低价=2,收盘价=3
            int openField = 0;
            int highField = 1;
            int lowField = 2;
            int closeField = 3;
            //添加K线
            CandleShape candleShape = chart.AddCandle("K线", openField, highField, lowField, closeField, div1);


            //添加第二个层,占30%
            ChartDiv div2 = chart.AddChartDiv(30);
            //设置X轴的格式
            div2.XScale.Format = "hh:mm";
            //声明成交量字段
            int volField = 4;
            //添加K线
            BarShape barShape = chart.AddBar("成交量", volField, div2);


            //获取数据源
            CTableEx dataSource = chart.DataSource;

            candleShape.StyleField = CTableEx.AutoField;
            candleShape.ColorField = CTableEx.AutoField;
            dataSource.AddColumn(candleShape.StyleField);
            dataSource.AddColumn(candleShape.ColorField);

            //读取文件,并填充数据
            String filePath = Application.StartupPath + "\\SH600000.txt";
            String content = File.ReadAllText(filePath, Encoding.Default);
            String[] strs = content.Split(new String[] { "\r\n" }, StringSplitOptions.RemoveEmptyEntries);
            int strsSize = strs.Length;
            for (int i = 2; i < strs.Length - 1; i++)
            {
                String str = strs[i];
                String[] subStrs = str.Split(new String[] { "," }, StringSplitOptions.RemoveEmptyEntries);
                double date = (Convert.ToDateTime(subStrs[0]) - new DateTime(1970, 1, 1)).TotalSeconds;
                double open = Convert.ToDouble(subStrs[1]);
                double high = Convert.ToDouble(subStrs[2]);
                double low = Convert.ToDouble(subStrs[3]);
                double close = Convert.ToDouble(subStrs[4]);
                double volume = Convert.ToDouble(subStrs[5]);
                double amount = Convert.ToDouble(subStrs[6]);
                dataSource.Set(date, openField, open);
                dataSource.Set(date, highField, high);
                dataSource.Set(date, lowField, low);
                dataSource.Set(date, closeField, close);
                dataSource.Set(date, volField, volume);
            }

            //刷新图像
            chart.RefreshGraph();

            //获取系统的画线工具
            List<String> systemPlots = chart.GetSystemPlots();
            //创建画线工具
            chart.AddPlot(System.Drawing.Color.FromArgb(200, 200, 200), System.Drawing.Color.White, "Trend", new Point(100, 100), 1, null, div1);
            chart.AddPlot(System.Drawing.Color.FromArgb(200, 200, 200), System.Drawing.Color.White, "Ellipse", new Point(200, 150), 1, null, div1);
            chart.AddPlot(System.Drawing.Color.FromArgb(200, 200, 200), System.Drawing.Color.White, "Rectangle", new Point(150, 150), 1, null, div1);

        }
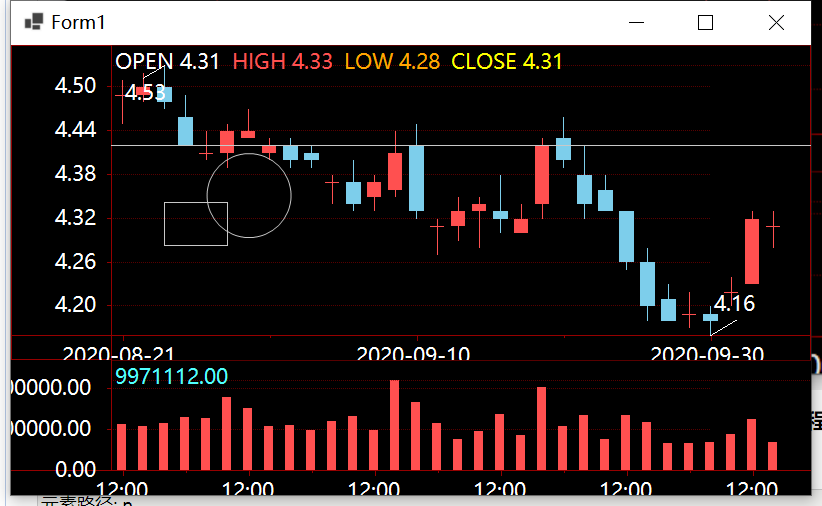
显示界面:
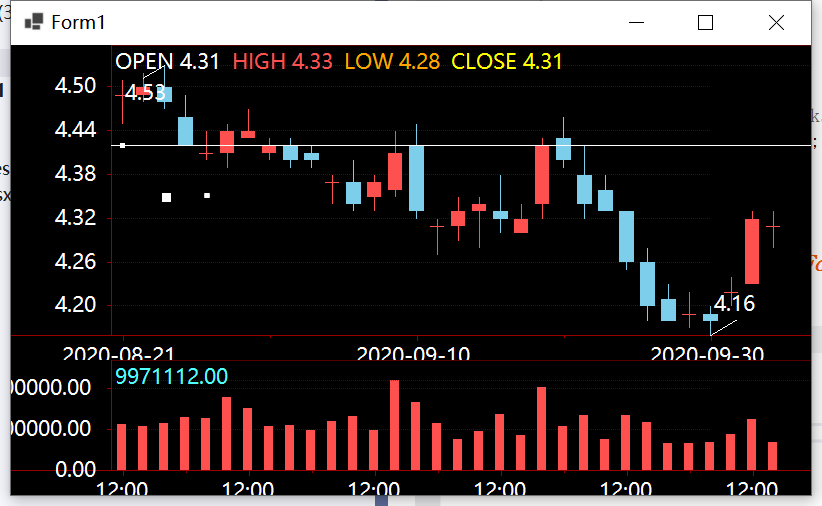
里面椭圆和正方形,在图形中是一个点,可以用鼠标操作扩大(问题:怎么通过编程的方式设置位置和大小呢?)