
Vue中按需引入ECharts、ECharts响应图表
npm install echarts --save

yarn add echarts --save  强烈推荐

cnpm install echarts --save
2、新建js文件-->myEhcarts.js

// myEhcarts.js
// 引入 echarts 核心模块,核心模块提供了 echarts 使用必须要的接口。
import * as echarts from 'echarts/core'

// 引入图表类型,图表后缀都为 Chart
import { BarChart, LineChart, PieChart, ScatterChart } from 'echarts/charts'

// 引入提示框,标题,直角坐标系等组件,组件后缀都为 Component
import {
  TitleComponent,
  TooltipComponent,
  GridComponent,
  LegendComponent,
  DatasetComponent,
  TransformComponent
} from 'echarts/components'
// 标签自动布局,全局过渡动画等特性
import { LabelLayout, UniversalTransition } from 'echarts/features'
// 引入 Canvas 渲染器,注意引入 CanvasRenderer 或者 SVGRenderer 是必须的一步
import { SVGRenderer } from 'echarts/renderers'

// 将以上引入的组件使用use()方法注册
echarts.use([
  TitleComponent,
  TooltipComponent,
  GridComponent,
  LegendComponent,
  DatasetComponent,
  TransformComponent,
  LabelLayout,
  UniversalTransition,
  BarChart,
  LineChart,
  PieChart,
  ScatterChart,
  SVGRenderer
])

// 导出
export default echarts
3、main.js引入创建的myEhcarts.js
// 引入echarts
import echarts from "./echarts/echarts";

// 挂载到vue实例中
Vue.prototype.$echarts = echarts

使用时 :  this.$echarts
4、案例
<template>
  <div>
  {{ $t('dashboard.analysis.week') }} //国际化
    <div id="main"></div>
    <div id="mayChar"></div>
  </div>

</template>

<script>
export default {
  data () {
    return {}
  },
  methods: {
    // 基本柱形图
    change () {
      const chartBox = this.$echarts.init(document.getElementById('main'))
      const option = {
        xAxis: {
          data: ['Mon', 'Tue', 'Wed', 'Thu', 'Fri', 'Sat', 'Sun']
        },
        yAxis: {},
        series: [
          {
            type: 'bar',
            data: [23, 24, 18, 25, 27, 28, 25]
          }
        ]
      }
      chartBox.setOption(option)
      // 根据页面大小自动响应图表大小
      window.addEventListener('resize', function () {
        chartBox.resize()
      })
    },
    // 折线图
    changetype () {
      // 获取组件实例
      const machart = this.$echarts.init(document.getElementById('mayChar'))
      // 设置配置项
      const option = {
        xAxis: {
          data: ['A', 'B', 'C', 'D', 'E']
        },
        yAxis: {},
        series: [
          {
            data: [10, 22, 28, 43, 49],
            type: 'line',
            stack: 'x'
          },
          {
            data: [5, 4, 3, 5, 10],
            type: 'line',
            stack: 'x'
          }
        ]
      }
      // 复制
      machart.setOption(option)
      // 根据页面大小自动响应图表大小
      window.addEventListener('resize', function () {
        machart.resize()
      })
    }
  },
  mounted () {
    this.change()
    this.changetype()
  }
}
</script>

<style lang="less" scoped>
#main {
  min-width: 31.25rem;
  min-height: 31.25rem;
  // max-height: 500px;
}
#mayChar {
  max-height: 500px;
  // max-height: 400px;
  height: 500px;
}
</style>
效果: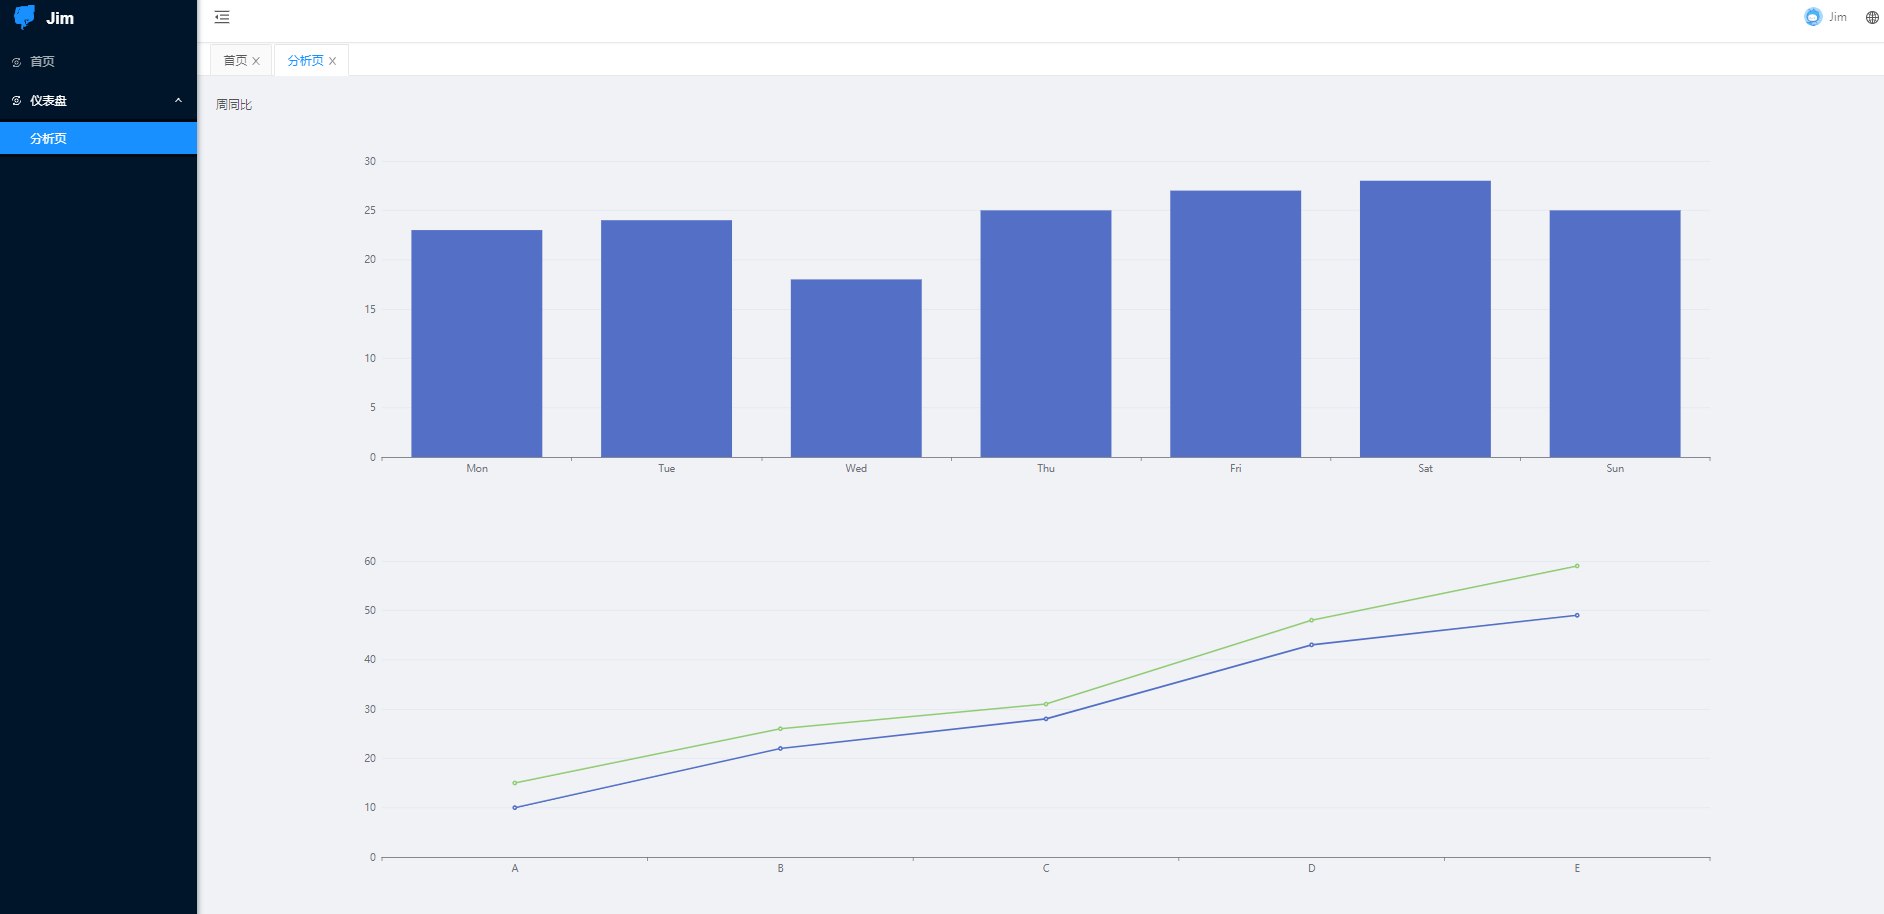


【推荐】国内首个AI IDE,深度理解中文开发场景,立即下载体验Trae
【推荐】编程新体验,更懂你的AI,立即体验豆包MarsCode编程助手
【推荐】抖音旗下AI助手豆包,你的智能百科全书,全免费不限次数
【推荐】轻量又高性能的 SSH 工具 IShell:AI 加持,快人一步
· 地球OL攻略 —— 某应届生求职总结
· 周边上新:园子的第一款马克杯温暖上架
· Open-Sora 2.0 重磅开源!
· 提示词工程——AI应用必不可少的技术
· .NET周刊【3月第1期 2025-03-02】