想要的图像如下:

一开始是这样画的:
import numpy as np                 #使用import导入模块numpy,并简写成np
import matplotlib.pyplot as plt    #使用import导入模块matplotlib.pyplot,并简写成plt
plt.figure(figsize=(8,4))          #设置绘图对象的宽度和高度

t = np.arange(0,1.1,0.1)
theta = 30+15*(t**2)
theta_v = 30*t
theta_accel = 30

plt.plot(t,theta,label="$theta$",color="red",linewidth=2)
plt.plot(t,theta_v,label="$thetaV$",color="green",linewidth=2)
#plt.plot(t,theta_accel,label="$thetaAccel$",color="blue",linewidth=2)

t = np.arange(1,3.1,0.1)
theta = 45+30*(t-1)
theta_v = 30
theta_accel = 0

plt.plot(t,theta,label="$theta$",color="red",linewidth=2)
#plt.plot(t,theta_v,label="$thetaV$",color="green",linewidth=2)
#plt.plot(t,theta_accel,label="$thetaAccel$",color="blue",linewidth=2)

t = np.arange(3,4.1,0.1)
theta = 120-15*((4-t)**2)
theta_v = 30*(4-t)
theta_accel = -30

plt.plot(t,theta,label="$theta$",color="red",linewidth=2)
plt.plot(t,theta_v,label="$thetaV$",color="green",linewidth=2)
#plt.plot(t,theta_accel,label="$thetaAccel$",color="blue")

plt.ylim(-40,200)             #使用plt.ylim设置y坐标轴范围
plt.xlim(-1,5)
plt.xlabel("Time(s)")         #用plt.xlabel设置x坐标轴名称
plt.legend(loc='upper left')  #设置图例位置
plt.grid(True)
plt.show()
#plt.plot(t,theta_accel,label="$thetaAccel$",color="blue",linewidth=2)
可以发现当theta_accel为常数时 plot失效,无法画出图像。
因为theta_accel = -30 不含变量t,改为:
theta_accel = -30 +t*0
则函数能够画出想要画的图像。
修改完,代码如下:
"""niku 习题5.5"""
import numpy as np                 #使用import导入模块numpy,并简写成np
import matplotlib.pyplot as plt    #使用import导入模块matplotlib.pyplot,并简写成plt
plt.figure(figsize=(8,4))          #设置绘图对象的宽度和高度

t = np.arange(0,1.1,0.1)
theta = 30+15*(t**2)
theta_v = 30*t
theta_accel = 30+t*0

plt.plot(t,theta,label="$theta$",color="red",linewidth=2)
plt.plot(t,theta_v,label="$thetaV$",color="green",linewidth=2)
plt.plot(t,theta_accel,label="$thetaAccel$",color="b")

t = np.arange(1,3.1,0.1)
theta = 45+30*(t-1)
theta_v = 30+t*0
theta_accel = 0 +t*0

plt.plot(t,theta,label="$theta$",color="red",linewidth=2)
plt.plot(t,theta_v,label="$thetaV$",color="green",linewidth=2)
plt.plot(t,theta_accel,label="$thetaAccel$",color="b",linewidth=2)

t = np.arange(3,4.1,0.1)
theta = 120-15*((4-t)**2)
theta_v = 30*(4-t)
theta_accel = -30 +t*0

plt.plot(t,theta,label="$theta$",color="red",linewidth=2)
plt.plot(t,theta_v,label="$thetaV$",color="green",linewidth=2)
plt.plot(t,theta_accel,label="$thetaAccel$",color="b")

plt.ylim(-40,125)             #使用plt.ylim设置y坐标轴范围
plt.xlim(-1,5)
plt.xlabel("Time(s)")         #用plt.xlabel设置x坐标轴名称
'''设置图例位置'''
#plt.legend(loc='upper right')  #设置图例位置
plt.grid(True)
plt.show()
生成图像如下:
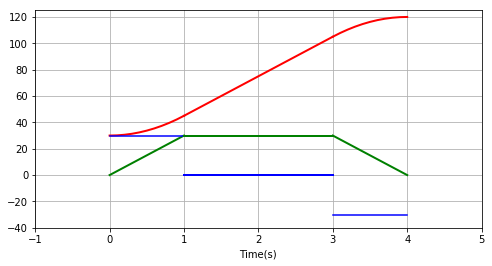
成功!!!