PyTorch - 01 - 线性回归(手写实现以及PyTorch实现)
手动写线性回归与用PyTorch写线性回归
我们可以手写一个简单的线性回归模型,作为机器学习的入门程序。但是现在有很多集成工具,比如PyTorch。
下面通过两种方法来感受一下实现上有哪些不同之处
linear regression
import torch
import numpy as numpy
from tqdm import tqdm
from matplotlib import pyplot as plt
generate data
# y = X * w + b + noise
true_w, true_b = 2.35, 1.25 # the correct value of w,b

num_features, num_samples = 1, 100

train_x = torch.randn(num_samples, num_features)
true_data = true_w*train_x + true_b
train_y = true_data + torch.normal(0, 1, true_data.size())

print('1th data:', train_x[0], train_y[0])
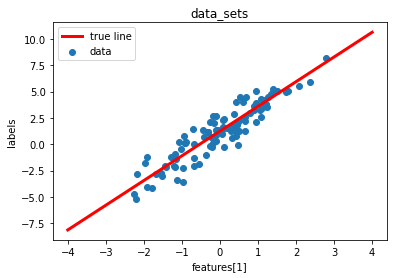
plt.scatter(train_x, train_y)
plt.plot([-4., 4.], [-4.*true_w+true_b, 4.*true_w+true_b], linewidth = '3', label = "true", color='red')
plt.legend(["true line","data"]), plt.xlabel('features[1]'),plt.ylabel('labels'),plt.title("data_sets"),plt.show()
1th data: tensor([-0.9585]) tensor([0.7902])

data loader function
def data_loader(size, data, labels):
    """
    :param size: batch size
    :param data: input data sets
    :param labels: true
    :return: a batch data set iterator
    """
    num_samples = len(data)
    indices = torch.randperm(num_samples)
    for i in range(0, num_samples, size):
        index = indices[i : min(i + size, num_samples)]
        yield data[index], labels[index]

# output 1th data
for x, y in data_loader(20, train_x, train_y):
    print('x shape: ',x.shape)
    print('y shape: ',y.shape)
    break
x shape:  torch.Size([20, 1])
y shape:  torch.Size([20, 1])
initialize parameters
w = torch.normal(0, 0.01, [num_features, 1])
b = torch.zeros(1)
w.requires_grad_(True)
b.requires_grad_(True)
print('w: ',w)
print('b: ',b)
w:  tensor([[-0.0133]], requires_grad=True)
b:  tensor([0.], requires_grad=True)
model definite
def linear_regression(x, w ,b):
    return torch.mm(x,w) + b
loss function
def square_loss(pred_y, true_y):
    return (pred_y - true_y.view(pred_y.size()))**2
optimizer
def SGD(params, learning_rate, size):
    for param in params:
        param.data -= learning_rate*param.grad/size
train
# 修改参数可以达到不同的拟合效果
lr, epochs = 0.01,  1000
batch_size = 1000

for epoch in range(epochs):
    for x, y in data_loader(batch_size, train_x, train_y):
        loss = square_loss(linear_regression(x, w, b), y).sum()
        loss.backward()
        SGD([w, b], lr, batch_size)
        w.grad.data.zero_()
        b.grad.data.zero_()
    train_loss = square_loss(linear_regression(train_x, w, b), train_y)
    if(epoch % 100 == 0):
        print("epoch : %d , train loss : %f" % (epoch, train_loss.mean().item()))
print('w: ', w, ' b: ', b)
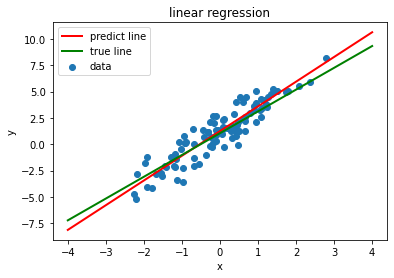
plt.scatter(train_x, train_y)
plt.plot([-4., 4.],[-4.*true_w+true_b, 4.*true_w+true_b], linewidth = '2', label = "true", color='red')
plt.plot([-4., 4.], [-4.*w+b, 4.*w+b], linewidth = '2', label = "true", color='green')
plt.xlabel('x'),plt.ylabel('y')
plt.title("linear regression")
plt.legend(["predict line","true line","data"])
plt.show()
epoch : 0 , train loss : 8.651114
epoch : 100 , train loss : 5.931528
epoch : 200 , train loss : 4.189598
epoch : 300 , train loss : 3.073121
epoch : 400 , train loss : 2.357027
epoch : 500 , train loss : 1.897408
epoch : 600 , train loss : 1.602190
epoch : 700 , train loss : 1.412425
epoch : 800 , train loss : 1.290352
epoch : 900 , train loss : 1.211762
w:  tensor([[2.0725]], requires_grad=True)  b:  tensor([1.0499], requires_grad=True)

使用PyTorch来实现线性回归,会简单很多,下面是实现过程:
code with PyTorch simply
import torch
import torch.nn as nn
from matplotlib import pyplot as plt
data
x_num, feature_num = 100, 1

true_w, true_b = 1., -3.

train_x = torch.normal(0, 1, [x_num, feature_num])

true_data = true_w * train_x + true_b
noise = torch.normal(0, 0.25, true_data.size())
train_y = true_data + noise

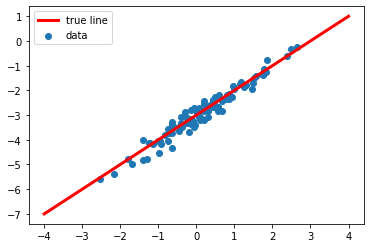
plt.scatter(train_x, train_y)
plt.plot([-4., 4.], [true_w*-4.+true_b, true_w*4.+true_b], linewidth = '3', label = "true", color='red')
plt.legend(["true line","data"])
plt.show()

torch data loader
import torch.utils.data as Data

batch_size = 10
data_set = Data.TensorDataset(train_x, train_y)
data_iter = torch.utils.data.DataLoader(data_set, batch_size, shuffle=True)
print(data_iter)
for X, y in data_iter:
    print(X.size(), y.size())
    break
<torch.utils.data.dataloader.DataLoader object at 0x000001AD2D8BF370>
torch.Size([10, 1]) torch.Size([10, 1])
linear net
class LinearNet(nn.Module):
    def __init__(self, num_feature):
        super(LinearNet, self).__init__()
        self.linear = nn.Linear(num_feature, 1)

    def forward(self, x):
        return self.linear(x)

net = LinearNet(feature_num)

# initialize parameter
nn.init.normal_(net.linear.weight, mean=0, std=0.01)
nn.init.constant_(net.linear.bias, val=0)

# cost function
loss = nn.MSELoss()

# optimizer
optimizer = torch.optim.SGD(net.parameters(), lr=0.03)

# train
epochs = 5
for epoch in range(epochs):
    cost = 0.0
    for X, y in data_iter:
        output = net(X)
        cost = loss(output, y.view(-1, 1))

        optimizer.zero_grad()
        cost.backward()
        optimizer.step()
    print("epoch %d, loss: %f" % (epoch, cost.item()))
print('\n', true_w, true_b,'\n')
print(net.linear.weight, net.linear.bias)

pred_w = net.linear.weight
pred_b = net.linear.bias
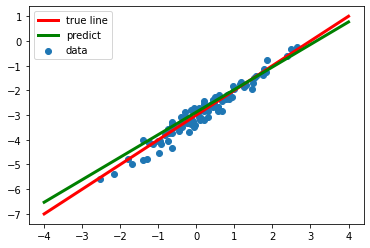
plt.scatter(train_x, train_y)
plt.plot([-4., 4.], [true_w*-4.+true_b, true_w*4.+true_b], linewidth = '3', label = "true", color='red')
plt.plot([-4., 4.], [pred_w*-4.+pred_b, pred_w*4.+pred_b], linewidth = '3', label = "true", color='green')
plt.legend(["true line","predict", "data"])
plt.show()
epoch 0, loss: 2.461334
epoch 1, loss: 1.148570
epoch 2, loss: 0.322340
epoch 3, loss: 0.122028
epoch 4, loss: 0.200466

 1.0 -3.0

Parameter containing:
tensor([[0.9121]], requires_grad=True) Parameter containing:
tensor([-2.8788], requires_grad=True)

希望能一辈子学习,希望能学习一辈子。
(^ _ ^)


