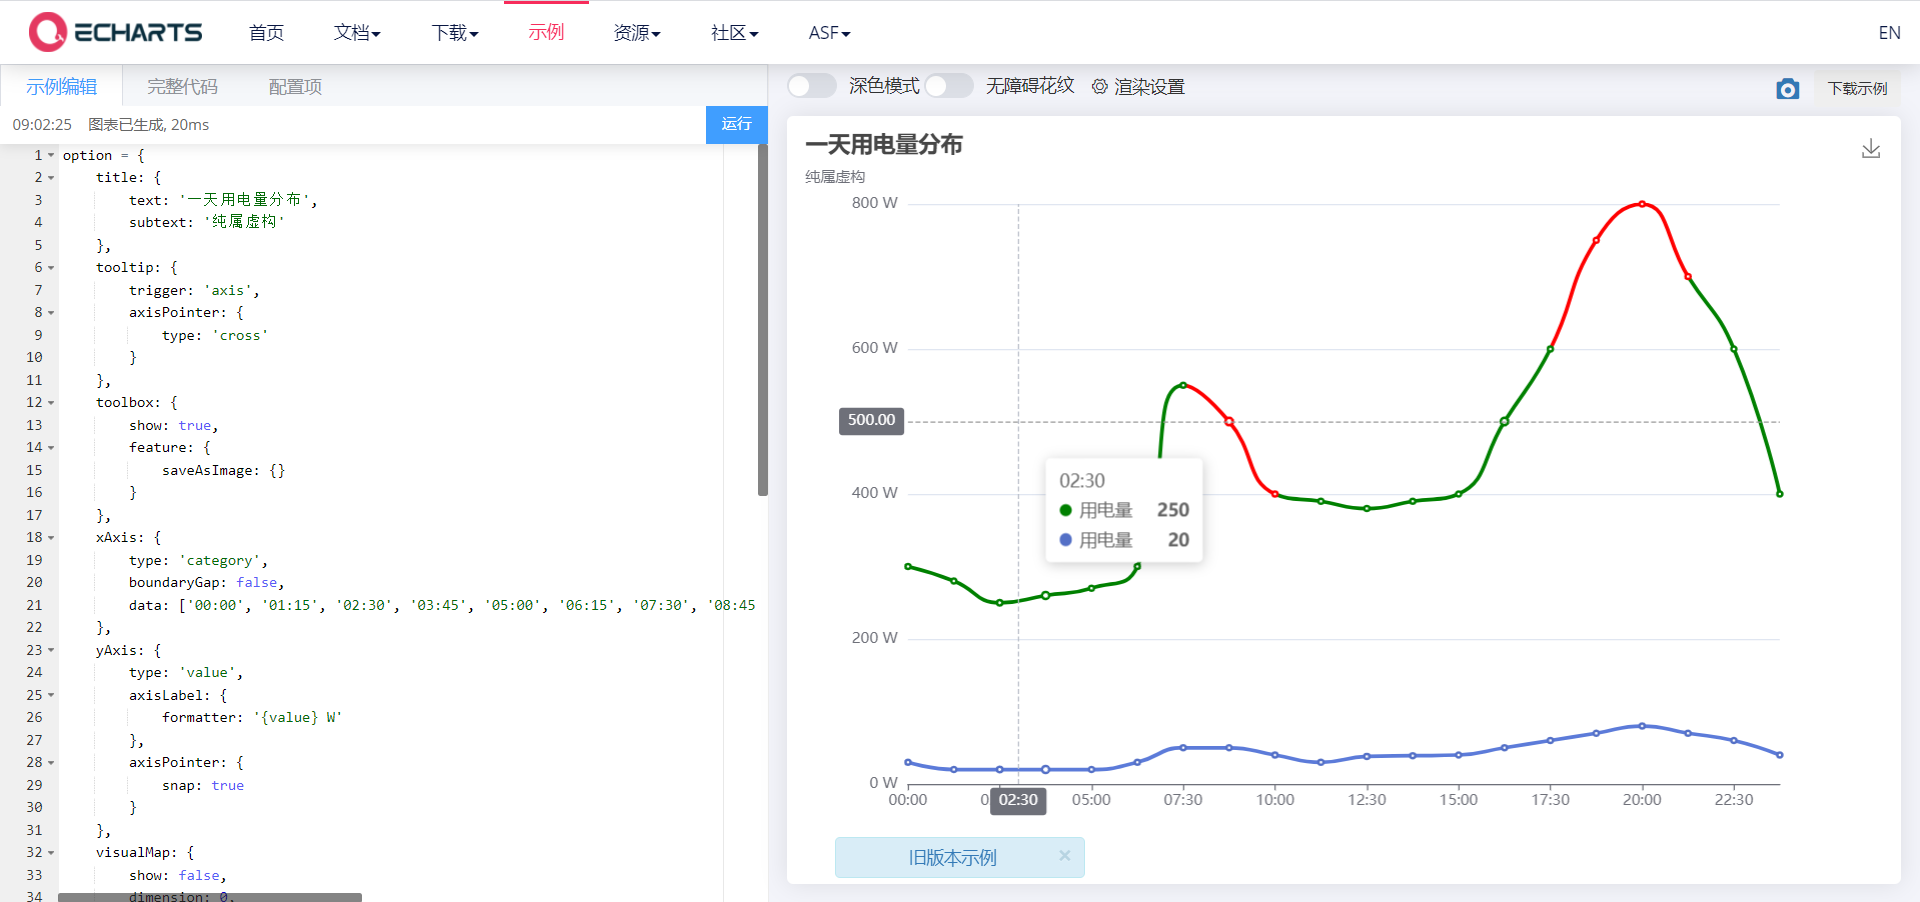
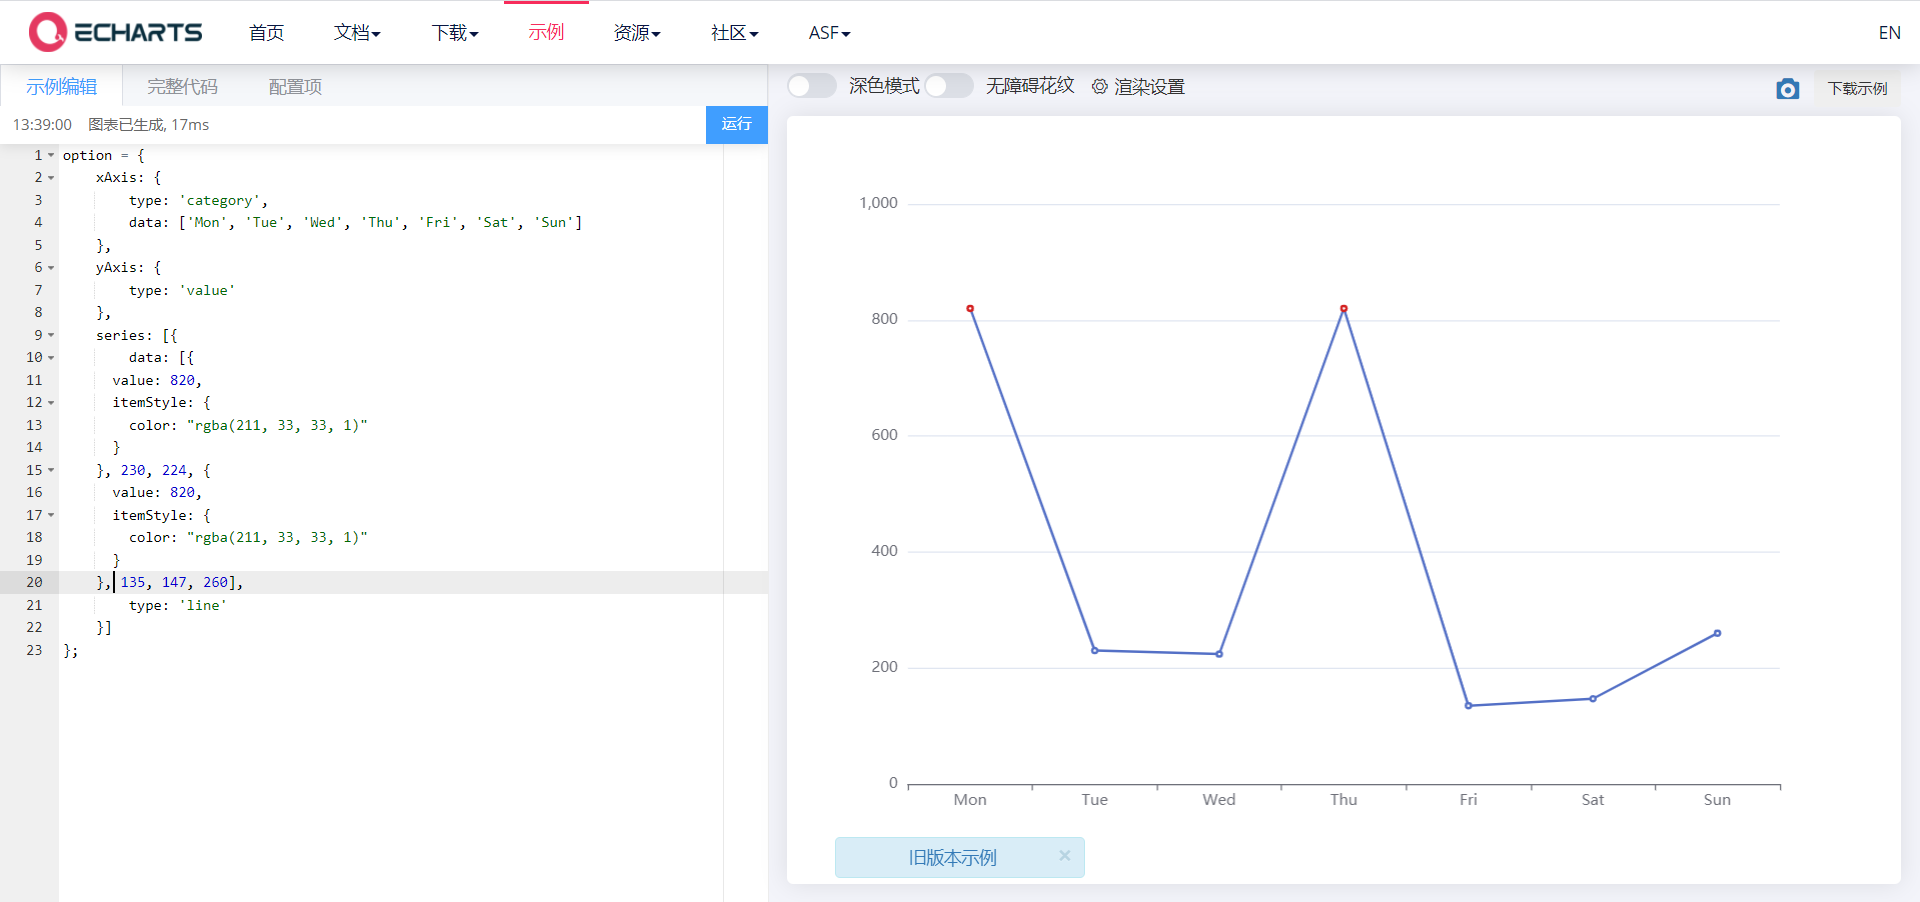
echars 折线图之一条线显示不同颜色,及拐点显示不同颜色

option = {
    title: {
        text: '一天用电量分布',
        subtext: '纯属虚构'
    },
    tooltip: {
        trigger: 'axis',
        axisPointer: {
            type: 'cross'
        }
    },
    toolbox: {
        show: true,
        feature: {
            saveAsImage: {}
        }
    },
    xAxis: {
        type: 'category',
        boundaryGap: false,
        data: ['00:00', '01:15', '02:30', '03:45', '05:00', '06:15', '07:30', '08:45', '10:00', '11:15', '12:30', '13:45', '15:00', '16:15', '17:30', '18:45', '20:00', '21:15', '22:30', '23:45']
    },
    yAxis: {
        type: 'value',
        axisLabel: {
            formatter: '{value} W'
        },
        axisPointer: {
            snap: true
        }
    },
    visualMap: {
        show: false,
        dimension: 0,
        seriesIndex :0,

        pieces: [{
            lte: 6,
            color: 'green'
        }, {
            gt: 6,
            lte: 8,
            color: 'red'
        }, {
            gt: 8,
            lte: 14,
            color: 'green'
        }, {
            gt: 14,
            lte: 17,
            color: 'red'
        }, {
            gt: 17,
            color: 'green'
        }]
    },
    series: [
        {
            name: '用电量',
            type: 'line',
            smooth: true,
            data: [300, 280, 250, 260, 270, 300, 550, 500, 400, 390, 380, 390, 400, 500, 600, 750, 800, 700, 600, 400],
        },
        {
            name: '用电量',
            type: 'line',
            smooth: true,
            data: [30, 20, 20, 20, 20, 30, 50, 50, 40, 30, 38, 39, 40, 50, 60, 70, 80, 70, 60, 40],
        }
    ]
};
这是关于一条线展示两个颜色的

option = {
    xAxis: {
        type: 'category',
        data: ['Mon', 'Tue', 'Wed', 'Thu', 'Fri', 'Sat', 'Sun']
    },
    yAxis: {
        type: 'value'
    },
    series: [{
        data: [{
      value: 820,
      itemStyle: {
        color: "rgba(211, 33, 33, 1)"
      }
    }, 230, 224, {
      value: 820,
      itemStyle: {
        color: "rgba(211, 33, 33, 1)"
      }
    }, 135, 147, 260],
        type: 'line'
    }]
};
这是针对拐点处颜色的


