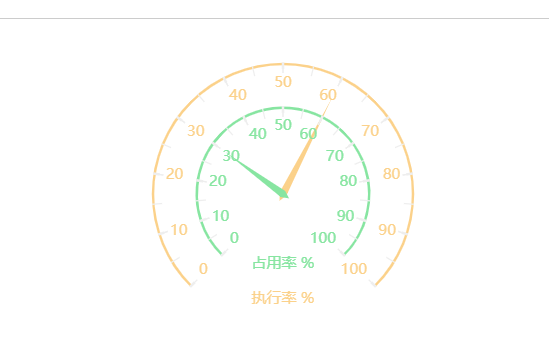
仪表盘双层结构图

// 基于准备好的dom,初始化echarts实例
        let myChart = this.$echarts.init(document.getElementById("main"));
        // 指定图表的配置项和数据
        let option = {
          // backgroundColor: "#000",
          width:'400px',
          height:'300px',
          tooltip: {
            formatter: '{a} <br/>{b} : {c}%',
            borderColor: "#ccc", // 提示框浮层的边框颜色。
          },
          grid: {
            left: "3%",
            right: "4%",
            bottom: "3%",
            width: "300px",
            height: "280px",
            containLabel: true
          },
          exporting: {
            enabled:false
          },
          series: [
            {
              type: 'gauge',
              name:'执行率',
              axisLine:{
                lineStyle:{
                  width:2,
                  color: [
                    [1, new  this.$echarts.graphic.LinearGradient(0, 0, 1, 0, [{
                      offset: 0.1,
                      color: "#FBD18A"
                    },
                      {
                        offset: 0.5,
                        color: "#FBD18A"
                      },
                      {
                        offset: 1,
                        color: "#FBD18A"
                      }
                    ])]
                  ],
                  shadowColor : '#red', //默认透明
                  shadowBlur: 10
                }
              },
              splitLine:{
                length:5,
                color:'#FBD18A'
              },
              axisTick:{
                splitNumber:2
              },
              axisLabel:{
                textStyle:{
                  color:'#FBD18A'
                }
              },
              pointer:{
                width:3
              },
              title:{
                offsetCenter:['0%','80%'],
                fontSize:12,
                color:'#FBD18A'
              },
              detail: {show:false},
              data: [{value: 60, name: '执行率 %'}]
            },
            {
              type: 'gauge',
              name:'占用率',
              radius: '50%',
              axisLine:{
                lineStyle:{
                  width:2,
                  color:[[0.1, '#87E5A1'],[1, '#87E5A1']]
                }
              },
              splitLine:{
                length:5,
                color:'#FBD18A'
              },
              axisTick:{
                splitNumber:2,
                color:'#FBD18A'
              },
              pointer:{
                width:3
              },
              title:{
                offsetCenter:['0%','80%'],
                fontSize:12,
                color:'#87E5A1'
              },
              detail: {show:false},
              data: [{value: 30, name: '占用率 %'}]
            }
          ]
        };
        // 使用刚指定的配置项和数据显示图表。
        myChart.setOption(option);

  项目需求,做一个大的仪表套小的仪表

posted @ 2020-12-08 09:15  宸泽岚  阅读(285)  评论(0编辑  收藏  举报