
perf/systemtap在线调试简明用法
perf
实时观察指定CPU
perf top -C 8 --call-graph dwarf,4096 -r 30 -K
先记录到文件,在通过文件做事后分析
perf record -C 8-25 --call-graph dwarf,4096
perf report -i perf.data -g
注:如果是那种短暂瞬时出现的问题,且不一定什么时候出现的问题。记录时间很长
会把问题当时的统计值拉平。
这时候可以让record命令分段输出文件。比如十分钟一个,然后当问题出现的时候,只
分析这个十分钟的report即可。
观察调用栈:
perf record -g --call-graph fp
长期记录record信息
perf record -C 5-26 --call-graph dwarf,4096 -T --switch-output=10G --timestamp-filename --timestamp-boundary
长期记录record信息,按时间段report
要用per report --time 的话,就不能用--switch-output参数record了。
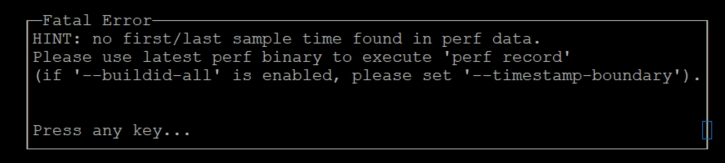
perf record -C 5-26 --call-graph dwarf,4096 -T --timestamp-filename --timestamp-boundary --buildid-all
perf report -i perf.data.2024061820091326 --time 70%-75%
systemtap
1 介绍
systemtap是一个不需要重新编译内核,直接在线调试linux内核的工具。
Without SystemTap, monitoring the activity of a running kernel would require a tedious instrument, recompile, install, and reboot sequence. SystemTap is designed to eliminate this and allows users to gather the same information by running user-written SystemTap scripts.
除了内核,用户态程序他也行,但是需要开两个编译选项进行支持。
However, SystemTap's ability to probe user-space events depends on kernel support (the Utrace mechanism) that is not available in many kernels. As a consequence, only some kernel versions support user-space probing.
它的原理大概就是,把stp脚本翻译成c代码,然后编译成内核模块,然后插入到内核里,执行stp脚本中定义的相应调试功能。
Thestapcommand reads probing instructions from a SystemTap script, translates these instructions into C code, builds a kernel module, and loads it into the running Linux kernel.
2 安装
装systamtap工具,装内核devel包。
yum install systemtap systemtap-runtime
yum install kernelname-devel-versiondebuginfo-install kernelname-version
3 基本语法
stp脚本,有event和handler两个核心概念。注册event,等他发生调用handler执行,handler里的内容由用户定义,也就是调试功能的语句。
SystemTap scripts are made up of two components:eventsandhandlers. Once a SystemTap session is underway, SystemTap monitors the operating system for the specified events and executes the handlers as they occur.
An event and its corresponding handler is collectively called aprobe. A SystemTap script can have multiple probes.
A probe's handler is commonly referred to as aprobe body.
Events serve as the triggers for handlers to run; handlers can be specified to record specified data and print it in a certain manner.
3.1
语法的样式如下:
probe event {statements}
大括号里的内容语法和C语言一样。
Statement blocks in SystemTap scripts follow the same syntax and semantics as the C programming language.
3.2 分同步和异步两类probe
同步的就是各种调试入口点,内核函数,模块函数等。
probe kernel.function("*@net/socket.c") { }
probe kernel.function("*@net/socket.c").return { }
probe module("ext3").function("*") { }
probe module("ext3").function("*").return { }
异步是各种timer什么的,用来跟同步配合,收集信息,统计打印等。
Asynchronousevents are not tied to a particular instruction or location in code. This family of probe points consists mainly of counters, timers, and similar constructs.
3.3 手册和语法
见如下两处:
man stapprobes
https://sourceware.org/systemtap/SystemTap_Beginners_Guide/scripts.html
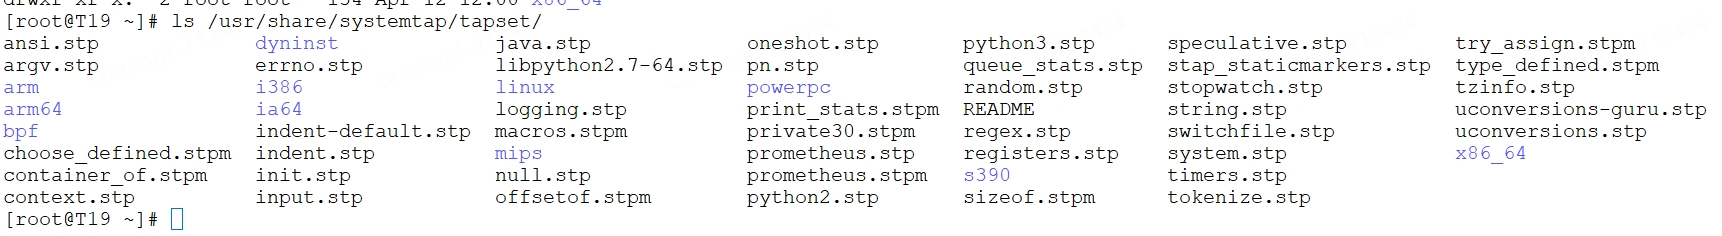
3.4 tapset
用来支持systemtap脚本的stp库
4 在用户态使用
内核要支持
grep CONFIG_UPROBES /boot/config-`uname -r`
grep CONFIG_UTRACE /boot/config-`uname -r`
用户态的所有命令probe 以 process()关键字开头,他的参数用来指明进程二进制或者进程id。
All user-space event probes begin with process.(命令关键字)
另外,用户态可以获取地址处的值。
另外,用户态还可以输出调用栈。
5 例子
如下例子,是线上myapp malloc 问题定位时用到的stp脚本。
===========================================================================
#! /usr/bin/env stap
## The following line command will probe all the functions
## in kernel's memory management code:
##
## stap functioncallcount.stp "*@mm/*.c"
probe process("/usr/bin/test").function("my_malloc").call { # probe functions listed on commandline
called[tid()] <<< 1 # add a count efficiently
}
global called
probe timer.sec(1)
{
foreach(i in called-) (
printf("%s, %d, %d\n", ctime(gettimeofday_s()), i, @count(called[i]))
)
delete called
}
==========================================================================
参考:https://sourceware.org/systemtap/SystemTap_Beginners_Guide/index.html

