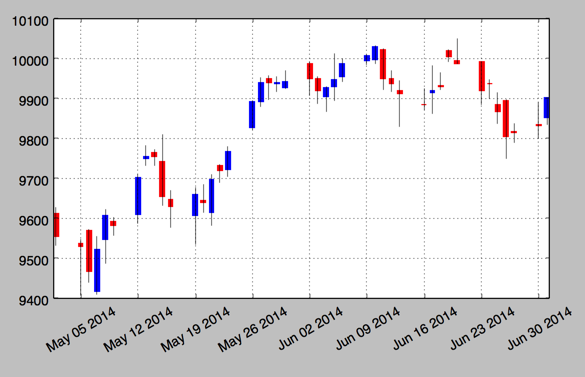
.烛柱图 candlestick
#!/etc/bin/python
#coding=utf-8
import matplotlib.pyplot as plt
import matplotlib.finance as mpf
start = (2014, 5,1)
end = (2014, 7,1)
quotes = mpf.quotes_historical_yahoo('^GDAXI',start,end)
# print quotes[:2]

fig, ax = plt.subplots(figsize=(8,5))
fig.subplots_adjust(bottom = 0.2)
mpf.candlestick(ax, quotes, width=0.6, colorup='b',colordown='r')
plt.grid(True)
ax.xaxis_date() #x轴上的日期
ax.autoscale_view()
plt.setp(plt.gca().get_xticklabels(),rotation=30) #日期倾斜
plt.show()
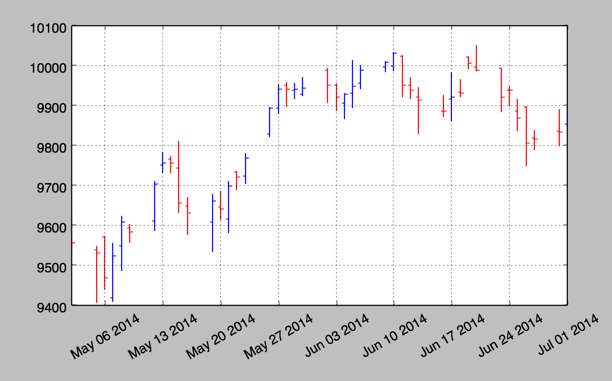
plot_day_summary
#!/etc/bin/python
#coding=utf-8
import matplotlib.pyplot as plt
import matplotlib.finance as mpf
start = (2014, 5,1)
end = (2014, 7,1)
quotes = mpf.quotes_historical_yahoo('^GDAXI',start,end)
# print quotes[:2]

fig, ax = plt.subplots(figsize=(8,5))
fig.subplots_adjust(bottom = 0.2)
mpf.plot_day_summary(ax, quotes,  colorup='b',colordown='r')
plt.grid(True)
ax.xaxis_date() #x轴上的日期
ax.autoscale_view()
plt.setp(plt.gca().get_xticklabels(),rotation=30) #日期倾斜
plt.show()
3.股价数据和成交量
#!/etc/bin/python
#coding=utf-8
import matplotlib.pyplot as plt
import numpy as np
import matplotlib.finance as mpf
start = (2014, 5,1)
end = (2014, 7,1)
quotes = mpf.quotes_historical_yahoo('^GDAXI',start,end)
# print quotes[:2]

quotes = np.array(quotes)
fig, (ax1, ax2) = plt.subplots(2, sharex=True, figsize=(8,6))
mpf.candlestick(ax1, quotes, width=0.6,colorup='b',colordown='r')
ax1.set_title('Yahoo Inc.')
ax1.set_ylabel('index level')
ax1.grid(True)
ax1.xaxis_date()
plt.bar(quotes[:,0] - 0.25, quotes[:, 5], width=0.5)

ax2.set_ylabel('volume')
ax2.grid(True)
ax2.autoscale_view()
plt.setp(plt.gca().get_xticklabels(),rotation=30)
plt.show()


 浙公网安备 33010602011771号