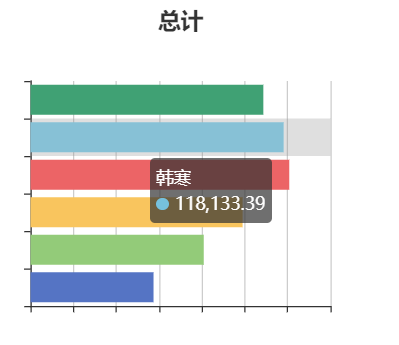
vue echarts 柱状图 变色 显示
echartscustom2(id,title,xdata,ydata){
var chartDom = document.getElementById(id);
var myChart = echarts.init(chartDom);
var option;
option = {
title:{
text:title,
left:"center"
},
tooltip: {
trigger: 'axis',
axisPointer: {
type: 'shadow'
},
},
xAxis: {
type: 'value',
axisLabel:{show:false}
},
yAxis: {
type: 'category',
data: ydata,
axisLabel:{show:false}
},
series: [{
data: xdata,
type: 'bar',
itemStyle: {
normal: {
color: function(params) {
var colorList = ['#5470c6', '#91cc75','#fac858','#ee6666','#73c0de','#3ba272','#fc8452','#9a60b4','#ea7ccc',];
var index=params.dataIndex%colorList.length;
return colorList[index]
}
}
},
}],
};
option && myChart.setOption(option);
},
xdata,ydata自造数组,color为滚动显示颜色组的颜色


