


贝叶斯决策分类(附代码)
参考课件:https://wenku.baidu.com/view/c462058f6529647d2728526a.html
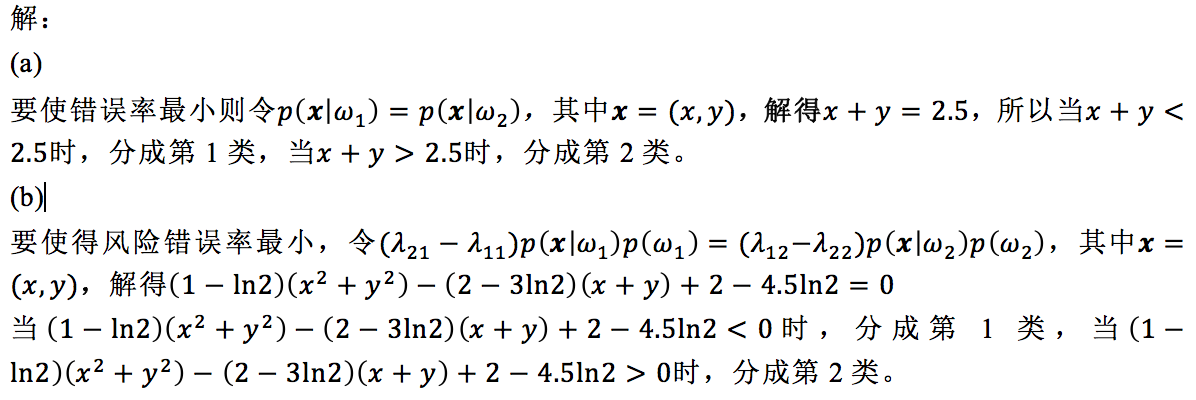
错误率最小化和风险最小化

代码:

import numpy as np
import matplotlib.pyplot as plt

from sklearn.ensemble import AdaBoostClassifier
from sklearn.tree import DecisionTreeClassifier
from sklearn.datasets import make_gaussian_quantiles


# Construct dataset
X1, y1 = make_gaussian_quantiles(mean=(1, 1),cov=0.2,
                                 n_samples=100, n_features=2,
                                 n_classes=1 )

X2, y2 = make_gaussian_quantiles(mean=(1.5, 1.5), cov=0.2,
                                 n_samples=100, n_features=2,
                                 n_classes=1)
X = np.concatenate((X1, X2))
y = np.concatenate((y1, y2+1 ))


# for class 1 error
errorNum = 0
for i in range(len(X)):
    if y[i] == 0 and X[i][0]+X[i][1]>2.5:
        errorNum += 1

print 'exp1 error rate for class 1 is '+str(errorNum)+'%'

# for class 2 error
errorNum = 0
for i in range(len(X)):
    if y[i] == 1 and X[i][0]+X[i][1]<2.5:
        errorNum += 1

print 'exp1 error rate for class 2 is '+str(errorNum)+'%'


# for class 1 risk
errorNum = 0
for i in range(len(X)):
    if y[i] == 0 and 0.368528*(X[i][0]*X[i][0]+X[i][1]*X[i][1])+0.07944*(X[i][0]+X[i][1])-1.119>0:
        errorNum += 1

print 'exp1 risk error rate for class 1 is '+str(errorNum)+'%'

# for class 2 risk
errorNum = 0
for i in range(len(X)):
    if y[i] == 1 and 0.368528*(X[i][0]*X[i][0]+X[i][1]*X[i][1])+0.07944*(X[i][0]+X[i][1])-1.119<0:
        errorNum += 1

print 'exp1 risk error rate for class 2 is '+str(errorNum)+'%'


plot_colors = "br"
plot_step = 0.02
class_names = "AB"

plt.figure(figsize=(8, 8))

# Plot the decision boundaries
plt.subplot(221)
x_min, x_max = X[:, 0].min() - 1, X[:, 0].max() + 1
y_min, y_max = X[:, 1].min() - 1, X[:, 1].max() + 1
xx, yy = np.meshgrid(np.arange(x_min, x_max, plot_step),
                     np.arange(y_min, y_max, plot_step))
Z = np.sign(xx+yy-2.5)
cs = plt.contourf(xx, yy, Z, cmap=plt.cm.Paired)
plt.axis("tight")

# Plot the training points
for i, n, c in zip(range(2), class_names, plot_colors):
    idx = np.where(y == i)
    plt.scatter(X[idx, 0], X[idx, 1],
                c=c, cmap=plt.cm.Paired,
                label="Class %s" % n)
plt.xlim(x_min, x_max)
plt.ylim(y_min, y_max)
plt.legend(loc='upper right')
plt.xlabel('x')
plt.ylabel('y')
plt.title('exp1 mini error')


plt.subplot(222)
x_min, x_max = X[:, 0].min() - 1, X[:, 0].max() + 1
y_min, y_max = X[:, 1].min() - 1, X[:, 1].max() + 1
xx, yy = np.meshgrid(np.arange(x_min, x_max, plot_step),
                     np.arange(y_min, y_max, plot_step))
Z = np.sign(0.368528*(xx*xx+yy*yy)+0.07944*(xx+yy)-1.119)
cs = plt.contourf(xx, yy, Z, cmap=plt.cm.Paired)
plt.axis("tight")

# Plot the training points
for i, n, c in zip(range(2), class_names, plot_colors):
    idx = np.where(y == i)
    plt.scatter(X[idx, 0], X[idx, 1],
                c=c, cmap=plt.cm.Paired,
                label="Class %s" % n)
plt.xlim(x_min, x_max)
plt.ylim(y_min, y_max)
plt.legend(loc='upper right')
plt.xlabel('x')
plt.ylabel('y')
plt.title('exp1 mini risk')

###############################################################################

# Construct dataset
X1, y1 = make_gaussian_quantiles(mean=(1, 1),cov=0.2,
                                 n_samples=100, n_features=2,
                                 n_classes=1 )

X2, y2 = make_gaussian_quantiles(mean=(3, 3), cov=0.2,
                                 n_samples=100, n_features=2,
                                 n_classes=1)
X = np.concatenate((X1, X2))
y = np.concatenate((y1, y2+1))


# for class 1 error
errorNum = 0
for i in range(len(X)):
    if y[i] == 0 and X[i][0]+X[i][1]>4:
        errorNum += 1

print 'exp2 error rate for class 1 is '+str(errorNum)+'%'

# for class 2 error
errorNum = 0
for i in range(len(X)):
    if y[i] == 1 and X[i][0]+X[i][1]<4:
        errorNum += 1

print 'exp2 error rate for class 2 is '+str(errorNum)+'%'


# for class 1 risk
errorNum = 0
for i in range(len(X)):
    if y[i] == 0 and 0.368528*(X[i][0]*X[i][0]+X[i][1]*X[i][1])+2.15888*(X[i][0]+X[i][1])-10.4766>0:
        errorNum += 1

print 'exp2 risk error rate for class 1 is '+str(errorNum)+'%'

# for class 2 risk
errorNum = 0
for i in range(len(X)):
    if y[i] == 1 and 0.368528*(X[i][0]*X[i][0]+X[i][1]*X[i][1])+2.15888*(X[i][0]+X[i][1])-10.4766<0:
        errorNum += 1

print 'exp2 risk error rate for class 2 is '+str(errorNum)+'%'

# Plot the decision boundaries
plt.subplot(223)
x_min, x_max = X[:, 0].min() - 1, X[:, 0].max() + 1
y_min, y_max = X[:, 1].min() - 1, X[:, 1].max() + 1
xx, yy = np.meshgrid(np.arange(x_min, x_max, plot_step),
                     np.arange(y_min, y_max, plot_step))
Z = np.sign(xx+yy-4)
cs = plt.contourf(xx, yy, Z, cmap=plt.cm.Paired)
plt.axis("tight")

# Plot the training points
for i, n, c in zip(range(2), class_names, plot_colors):
    idx = np.where(y == i)
    plt.scatter(X[idx, 0], X[idx, 1],
                c=c, cmap=plt.cm.Paired,
                label="Class %s" % n)
plt.xlim(x_min, x_max)
plt.ylim(y_min, y_max)
plt.legend(loc='upper right')
plt.xlabel('x')
plt.ylabel('y')
plt.title('exp2 mini error')


plt.subplot(224)
x_min, x_max = X[:, 0].min() - 1, X[:, 0].max() + 1
y_min, y_max = X[:, 1].min() - 1, X[:, 1].max() + 1
xx, yy = np.meshgrid(np.arange(x_min, x_max, plot_step),
                     np.arange(y_min, y_max, plot_step))
Z = np.sign(0.368528*(xx*xx+yy*yy)+2.15888*(xx+yy)-10.4766)
cs = plt.contourf(xx, yy, Z, cmap=plt.cm.Paired)
plt.axis("tight")

# Plot the training points
for i, n, c in zip(range(2), class_names, plot_colors):
    idx = np.where(y == i)
    plt.scatter(X[idx, 0], X[idx, 1],
                c=c, cmap=plt.cm.Paired,
                label="Class %s" % n)
plt.xlim(x_min, x_max)
plt.ylim(y_min, y_max)
plt.legend(loc='upper right')
plt.xlabel('x')
plt.ylabel('y')
plt.title('exp2 mini risk')


plt.tight_layout()
plt.subplots_adjust(wspace=0.35)
plt.show()
黄世宇/Shiyu Huang's Personal Page:https://huangshiyu13.github.io/
分类:
Machine Learning


【推荐】国内首个AI IDE,深度理解中文开发场景,立即下载体验Trae
【推荐】编程新体验,更懂你的AI,立即体验豆包MarsCode编程助手
【推荐】抖音旗下AI助手豆包,你的智能百科全书,全免费不限次数
【推荐】轻量又高性能的 SSH 工具 IShell:AI 加持,快人一步
· 开发者必知的日志记录最佳实践
· SQL Server 2025 AI相关能力初探
· Linux系列:如何用 C#调用 C方法造成内存泄露
· AI与.NET技术实操系列(二):开始使用ML.NET
· 记一次.NET内存居高不下排查解决与启示
· 阿里最新开源QwQ-32B,效果媲美deepseek-r1满血版,部署成本又又又降低了!
· 开源Multi-agent AI智能体框架aevatar.ai,欢迎大家贡献代码
· Manus重磅发布:全球首款通用AI代理技术深度解析与实战指南
· 被坑几百块钱后,我竟然真的恢复了删除的微信聊天记录!
· 没有Manus邀请码?试试免邀请码的MGX或者开源的OpenManus吧