

用dev控件作曲线图
项目中碰到一个要做曲线图的需求,所以特意研究了下,还没有研究的很透彻,先给出代码,这里举的是一个画一个星期的温度的曲线图的例子,先看前台页面:
 前台代码
前台代码

 1 <%@ Page Language="C#" AutoEventWireup="true" CodeBehind="drawMap.aspx.cs" Inherits="drawLineMap.drawMap" %>
 2 <%@ Register Assembly="DevExpress.XtraCharts.v8.2.Web, Version=8.2.4.0, Culture=neutral, PublicKeyToken=9b171c9fd64da1d1"
 3     Namespace="DevExpress.XtraCharts.Web" TagPrefix="dxchartsui" %>
 4     <%@ Register Assembly="DevExpress.XtraCharts.v8.2, Version=8.2.4.0, Culture=neutral, PublicKeyToken=9b171c9fd64da1d1"
 5      Namespace="DevExpress.XtraCharts" TagPrefix="cc1" %>
 6 <%@ Register Assembly="DevExpress.Web.v8.2, Version=8.2.4.0, Culture=neutral, PublicKeyToken=9b171c9fd64da1d1"
 7     Namespace="DevExpress.Web.ASPxRoundPanel" TagPrefix="dxrp" %>
 8
 9
10 <!DOCTYPE html PUBLIC "-//W3C//DTD XHTML 1.0 Transitional//EN" "http://www.w3.org/TR/xhtml1/DTD/xhtml1-transitional.dtd">
11
12 <html xmlns="http://www.w3.org/1999/xhtml" >
13 <head runat="server">
14     <title>无标题页</title>
15 </head>
16 <body>
17     <form id="form1" runat="server">
18     <div>
19         <dxchartsui:WebChartControl ID="WebChartControl1" runat="server" Height="540px" Width="800px" DiagramTypeName="XYDiagram">
20             <FillStyle FillOptionsTypeName="SolidFillOptions">
21                  <Options HiddenSerializableString="to be serialized" />
22             </FillStyle>
23             <Titles>
24                  <cc1:ChartTitle Text="曲线图"></cc1:ChartTitle>
25             </Titles>
26             <SeriesTemplate LabelTypeName="SideBySideBarSeriesLabel" PointOptionsTypeName="PointOptions" SeriesViewTypeName="SideBySideBarSeriesView">
27
28                  <PointOptions HiddenSerializableString="to be serialized"></PointOptions>
29                  <Label HiddenSerializableString="to be serialized" OverlappingOptionsTypeName="OverlappingOptions">
30                       <FillStyle FillOptionsTypeName="SolidFillOptions">
31                            <Options HiddenSerializableString="to be serialized" />
32                       </FillStyle>
33                  </Label>
34                  <View HiddenSerializableString="to be serialized"></View>
35                  <LegendPointOptions HiddenSerializableString="to be serialized"></LegendPointOptions>
36             </SeriesTemplate>
37
38
39         </dxchartsui:WebChartControl>
40
41     </div>
42     </form>
43 </body>
44 </html>
然后后台代码为:
后台代码
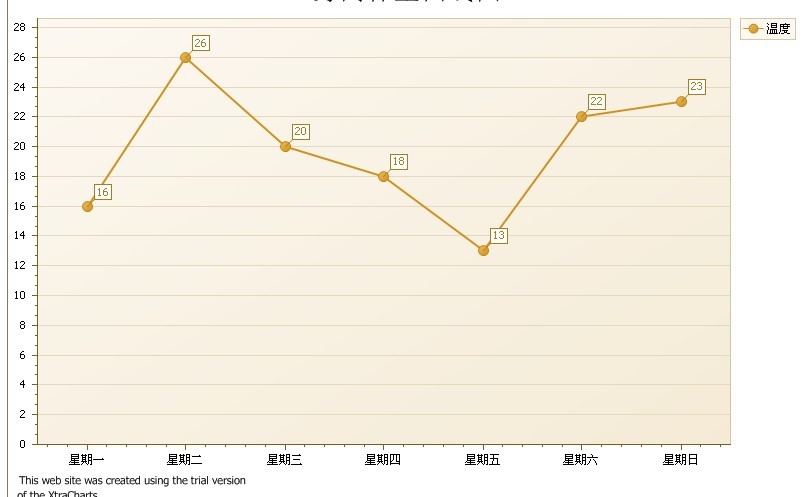
 1 protected void Page_Load(object sender, EventArgs e)
 2 {
 3             if (!IsPostBack)
 4             {
 5                 this.WritePhoto();
 6
 7             }
 8 }
 9 public void WritePhoto()
10 {
11             DataTable DataTableSource = this.GetData();
12
13            //定义线型,名称
14             Series height = new Series("温度", ViewType.Line);
15             //定义X轴的数据类型:质量,数字,时间
16             //S1.ArgumentScaleType = ScaleType.Qualitative;
17
18             //定义Y轴的数据类型:质量,数字,时间
19             height.ValueScaleType = ScaleType.Numerical;
20             //height.ValueScaleType = ScaleType.Numerical;
21             //定义线条上点的标志形状
22             //((LineSeriesView)S1.View).LineMarkerOptions.Kind = MarkerKind.Circle;
23             //线条类型:虚线实线,
24             //((LineSeriesView)S1.View).LineStyle.DashStyle = DashStyle.Solid;
25
26             //绑定数据源
27             height.DataSource = DataTableSource;
28
29             //定义X轴数据源字段
30             height.ArgumentDataMember = "day";
31
32             //定义Y轴数据源字段
33             height.ValueDataMembers[0] = "temperature";
34             //S1.View = new FrmChart();
35             //与控件绑定
36             WebChartControl1.Series.Add(height);
37 }
38 public  DataTable GetData()
39 {
40             DataTable dt = new DataTable();
41             dt.Columns.Add("day",typeof(string));
42             dt.Columns.Add("temperature",typeof(float));
43             dt.Rows.Add("星期一", 16);
44             dt.Rows.Add("星期二", 26);
45             dt.Rows.Add("星期三", 20);
46             dt.Rows.Add("星期四", 18);
47             dt.Rows.Add("星期五", 13);
48             dt.Rows.Add("星期六", 22);
49             dt.Rows.Add("星期日", 23);
50             return dt;
51 }
命名空间为:
命名空间
 1 using System.Configuration;
 2 using System.Collections;
 3 using System.Web;
 4 using System.Web.Security;
 5 using System.Web.UI;
 6 using System.Web.UI.WebControls;
 7 using System.Web.UI.WebControls.WebParts;
 8 using System.Web.UI.HtmlControls;
 9
10 //添加画图类
11 using System.Drawing.Drawing2D;
12 using System.Drawing.Imaging;
13 using System.Drawing;
14 using System.IO;
15 using System.Data.SqlClient;
16 using DevExpress.XtraCharts;
这里面也涉及到一些知识点,例如怎么画图,怎么定义你的线性,如何在一个datatable里添加列,再往这张表里面添加内容等等。
也有可能会遇到一些问题,
例如提示你,DevExpress中不存在类型或命名空间名称“web”;
这个问题的解决方式是,项目右键--添加引用,看看你的引用里面是否包含以下各项:

例如提示你:

这时你就应该在你的配置文件也就是Web.config中添加:
web.config
 1 <compilation debug="true">
 2             <assemblies>
 3
 4                 <add assembly="DevExpress.XtraCharts.v8.2.Web, Version=8.2.4.0, Culture=neutral, PublicKeyToken=9B171C9FD64DA1D1"/>
 5                 <add assembly="DevExpress.XtraCharts.v8.2, Version=8.2.4.0, Culture=neutral, PublicKeyToken=9B171C9FD64DA1D1"/>
 6                 <add assembly="DevExpress.Web.v8.2, Version=8.2.4.0, Culture=neutral, PublicKeyToken=9B171C9FD64DA1D1"/>
 7                 <add assembly="DevExpress.Charts.v8.2.Core, Version=8.2.4.0, Culture=neutral, PublicKeyToken=9B171C9FD64DA1D1"/>
 8                 <add assembly="DevExpress.Data.v8.2, Version=8.2.4.0, Culture=neutral, PublicKeyToken=9B171C9FD64DA1D1"/>
 9                 <add assembly="DevExpress.Utils.v8.2, Version=8.2.4.0, Culture=neutral, PublicKeyToken=9B171C9FD64DA1D1"/>
10                 <add assembly="DevExpress.XtraEditors.v8.2, Version=8.2.4.0, Culture=neutral, PublicKeyToken=9B171C9FD64DA1D1"/>
11
12             </assemblies>
13         </compilation>
然后别忘了设置好你的起始页就可以了。
最终画出来的图为:
附:(2013-07-05)
上面所画的图标出了每个点的值,且每个点都用一点来进行表示。
不想在曲线上标出值,可以添加:((PointSeriesLabel)series1.Label).Visible = false;
不想曲线上有那些点,可以添加:((LineSeriesView)series1.View).LineMarkerOptions.Visible = false;
posted on 2013-05-10 18:26 linxihuanghuang 阅读(1225) 评论(0) 编辑 收藏 举报
