

Spring-Boot-Actuator
1、Actuator
分布式导致部署服务的增多,运维人员压力倍增,传统的运维方法已经不适应相应的变化,需要对应的监控措施来确保衡量服务的运行情况。actuator为Spring Boot提供监控。
启动Spring-Boot-Actuator
- 添加依赖
        <dependency>
            <groupId>org.springframework.boot</groupId>
            <artifactId>spring-boot-starter-actuator</artifactId>
        </dependency>
- 开启对应端点访问
注:初始状态下,只开放了health和info,如需要访问需要开启其他端点。
#开启所有结点
management.endpoints.web.exposure.include=*

#指定开启的结点,多个结点间,号隔开
#management.endpoints.web.exposure.include=info,conditions

#设置端点访问路径前缀,默认是actuator
#访问具体端点方法:http://localhost:8080/{management.endpoints.web.base-path}/{端点名}
#management.endpoints.web.base-path=/actuator
注:部分端点SpringBoot1.0和2.0版本命名方法不一样,具体差异可在网上查阅。
本文以SpringBoot-2.3.4.RELEASE为例。
1.1 原生端点
-
应用配置类
获取应用中加载的应用配置、环境变量等配置信息。
-
度量指标类
获取程序运行过程中的各种度量指标,例如内存信息,线程池等,请求统计等度量信息。
-
操作控制类
提供对应应用的关闭等功能。
1.1.1 应用配置类
autoconfig/conditions
autocofing/condifiton表示同一个含义,只不过一个是1.0中的路径,一个是2.中的路径。
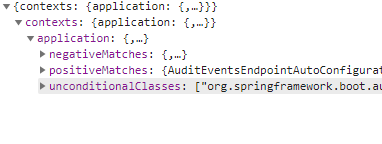
autoconfig/conditions包含应用加载时匹配的自动化配置相关信息,主要包含三部分:
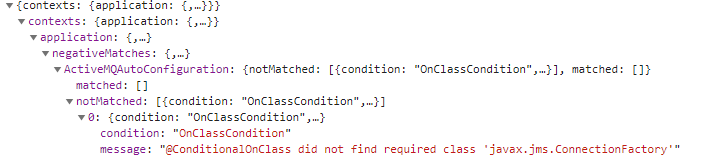
1.positiveMatches,包含了那些自动化配置生效了,是满足什么条件生效。
2.positiveMatches,那些自动化配置没有生效,是未满足那些条件。
3.unconditionalClasses,加载了那些无条件自动配置类。
通过访问``http://localhost:8080/actuator/autoconfig`获取对应配置信息(1.0版本访问路径)。
如果是2.0版本的需要将autoconfig修改为conditions。
beans
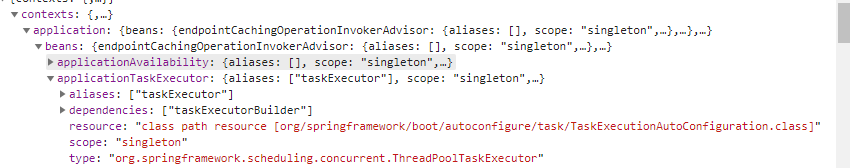
beans包含了应用中所有加载的bean信息,主要包含:
1. single,bean的作用域。

2. alias,bean的别名。
3. resource,bean的class文件位置。
4. dependencies,bena的依赖。
5. type,bean的具体java类型。
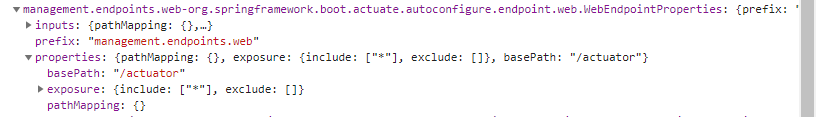
configprops
configprops可以获取配置文件相关配置信息。
例如配置了
management.endpoints.web.exposure.include=configprops
对应配置中include为configprops

配置了
management.endpoints.web.exposure.include=*
对应配置信息中include为*
env
env可以获取一些环境信息,例如java相关参数,server.port端口等信息。

mappings
mappings可以返回所有地址映射信息。
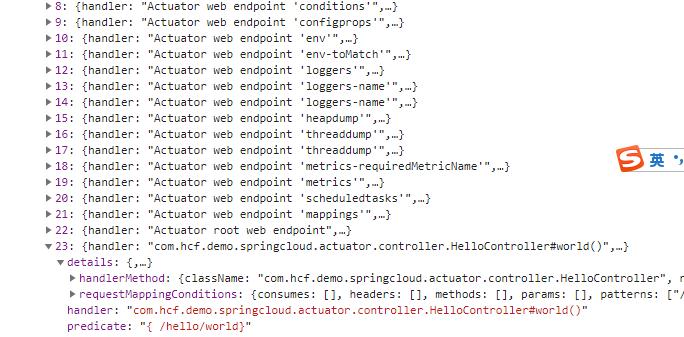
上图中有actuator相关的端点的路径映射信息,也有自行添加的控制器中的hello/wrold映射路径信息和具体类信息。
info
info端点会返回一些自定义信息。一般没有自定义信息的情况下会返回{}。
自定义配置的信息需要以info开头,才能被该端点返回,返回信息会去掉info前缀。
例如在配置文件中配置了自定义信息:
info.msg=my msg
test.ss=123
请求info对应返回信息。
{"msg":"my msg"}
1.1.2 度量指标类
引用配置类端点提供的信息大多是加载时就固定的信息。但度量指标类是记录应用运行过程中的信息是动态的。度量指标提供了许多运行中信息,便于对其分析。
metrics
mertrics可返回所有可以度量项的名称。
后续需要查看具体度量项,可通过 java /metrics/{度量项名称} 获取对应度量项详细信息。
metrics返回的度量项名称
{
	"names": [
	  "http.server.requests",
	  "jvm.buffer.count",
	  "jvm.buffer.memory.used",
	  "jvm.buffer.total.capacity",
	  "jvm.classes.loaded",
	  "jvm.classes.unloaded",
	  "jvm.gc.live.data.size",
	  "jvm.gc.max.data.size",
	  "jvm.gc.memory.allocated",
	  "jvm.gc.memory.promoted",
	  "jvm.gc.pause",
	  "jvm.memory.committed",
	  "jvm.memory.max",
	  "jvm.memory.used",
	  "jvm.threads.daemon",
	  "jvm.threads.live",
	  "jvm.threads.peak",
	  "jvm.threads.states",
	  "logback.events",
	  "process.cpu.usage",
	  "process.start.time",
	  "process.uptime",
	  "system.cpu.count",
	  "system.cpu.usage",
	  "tomcat.sessions.active.current",
	  "tomcat.sessions.active.max",
	  "tomcat.sessions.alive.max",
	  "tomcat.sessions.created",
	  "tomcat.sessions.expired",
	  "tomcat.sessions.rejected"
	]
}
度量信息的名称就可以很清晰的看出该度量项具体含义。
例如jvm.threads.live表示线程存活数。
通过访问 localhost:8080/actutor/jvm.threads.live即可访问对应度量项指标,每个度量项里面包含该度量项的具体描述。
访问对应度量项返回信息。
存活线程包含守护进程,有24个线程存活。
{
	"name": "jvm.threads.live",
	"description": "The current number of live threads including both daemon and non-daemon threads",
	"baseUnit": "threads",
	"measurements": [{
		"statistic": "VALUE",
		"value": 24.0
	}],
	"availableTags": []
}
baseUnit表示度量项的基本单元,对于线程度量项是线程。例如"process.start.time"基本单元是秒。内存相关是byte等。各个检测项返回格式基本相同,只是具体度量指标的内容不同。
http.server.requests
{
	"name": "http.server.requests",
	"description": null,
	"baseUnit": "seconds",
	"measurements": [{
		"statistic": "COUNT",//请求计数
		"value": 28.0
	}, {
		"statistic": "TOTAL_TIME",//请求总共耗时时间(累加)
		"value": 0.3409857
	}, {
		"statistic": "MAX",
		"value": 0.0416129
////请求最大耗时时间,当一段时间没有请求后,会变为0,具体可参考:
//https://stackoverflow.com/questions/57247185/spring-boot-actuator-max-property
	}],
	"availableTags": [{
		"tag": "exception",
		"values": ["None"]
	}, {
		"tag": "method",
		"values": ["GET"]
	}, {
		"tag": "uri",
		"values": ["/actuator/metrics/{requiredMetricName}", "/hello/world"]
	}, {
		"tag": "outcome",
		"values": ["SUCCESS"]
	}, {
		"tag": "status",
		"values": ["200"]
	}]
}
MAX为请求耗时最长的一次,可以看到第97和98个请求之间耗时0.0030536秒此时MAX是0.0030567,
第100和第101个请求之间间隔0.0073521,此时MAX是0.0073521。
第97个请求的max是0,当一段时间没有请求,MAX是0,没有请求即没有最大耗时请求时间。
等待一段时间,再次请求会发现第107个请求也是0.
[{"statistic":"COUNT","value":97.0},{"statistic":"TOTAL_TIME","value":11.5925958},{"statistic":"MAX","value":0.0}]
[{"statistic":"COUNT","value":98.0},{"statistic":"TOTAL_TIME","value":11.5956534},{"statistic":"MAX","value":0.0030576}]
[{"statistic":"COUNT","value":99.0},{"statistic":"TOTAL_TIME","value":11.598499},{"statistic":"MAX","value":0.0030576}]
[{"statistic":"COUNT","value":100.0},{"statistic":"TOTAL_TIME","value":11.6007708},{"statistic":"MAX","value":0.0030576}]
[{"statistic":"COUNT","value":101.0},{"statistic":"TOTAL_TIME","value":11.6081229},{"statistic":"MAX","value":0.0073521}]
[{"statistic":"COUNT","value":102.0},{"statistic":"TOTAL_TIME","value":11.610859699999999},{"statistic":"MAX","value":0.0073521}]
[{"statistic":"COUNT","value":103.0},{"statistic":"TOTAL_TIME","value":11.612984899999999},{"statistic":"MAX","value":0.0073521}]
[{"statistic":"COUNT","value":104.0},{"statistic":"TOTAL_TIME","value":11.615418799999999},{"statistic":"MAX","value":0.0073521}]
[{"statistic":"COUNT","value":105.0},{"statistic":"TOTAL_TIME","value":11.6184379},{"statistic":"MAX","value":0.0073521}]
[{"statistic":"COUNT","value":106.0},{"statistic":"TOTAL_TIME","value":11.620903499999999},{"statistic":"MAX","value":0.0073521}]
